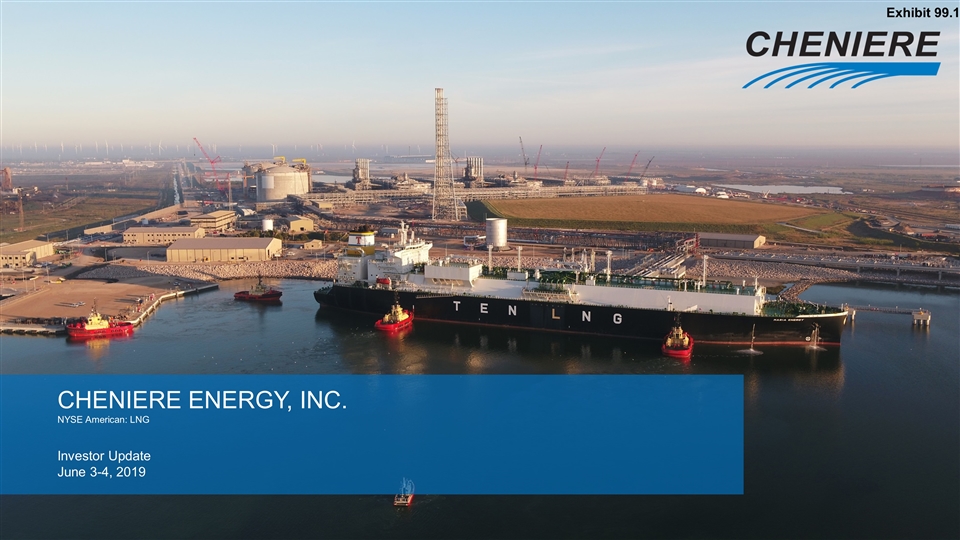

CHENIERE ENERGY, INC. NYSE American: LNG Investor Update June 3-4, 2019 Exhibit 99.1
Safe Harbor Statements Forward-Looking Statements This presentation contains certain statements that are, or may be deemed to be, “forward-looking statements” within the meaning of Section 27A of the Securities Act of 1933, as amended, and Section 21E of the Securities Exchange Act of 1934, as amended. All statements, other than statements of historical or present facts or conditions, included or incorporated by reference herein are “forward-looking statements.” Included among “forward-looking statements” are, among other things: statements regarding the ability of Cheniere Energy Partners, L.P. to pay distributions to its unitholders or Cheniere Energy, Inc. to pay dividends to its shareholders or participate in share or unit buybacks; statements regarding Cheniere Energy, Inc.’s or Cheniere Energy Partners, L.P.’s expected receipt of cash distributions from their respective subsidiaries; statements that Cheniere Energy Partners, L.P. expects to commence or complete construction of its proposed liquefied natural gas (“LNG”) terminals, liquefaction facilities, pipeline facilities or other projects, or any expansions or portions thereof, by certain dates or at all; statements that Cheniere Energy, Inc. expects to commence or complete construction of its proposed LNG terminals, liquefaction facilities, pipeline facilities or other projects, or any expansions or portions thereof, by certain dates or at all; statements regarding future levels of domestic and international natural gas production, supply or consumption or future levels of LNG imports into or exports from North America and other countries worldwide, or purchases of natural gas, regardless of the source of such information, or the transportation or other infrastructure, or demand for and prices related to natural gas, LNG or other hydrocarbon products; statements regarding any financing transactions or arrangements, or ability to enter into such transactions; statements relating to the construction of our proposed liquefaction facilities and natural gas liquefaction trains (“Trains”) and the construction of our pipelines, including statements concerning the engagement of any engineering, procurement and construction ("EPC") contractor or other contractor and the anticipated terms and provisions of any agreement with any EPC or other contractor, and anticipated costs related thereto; statements regarding any agreement to be entered into or performed substantially in the future, including any revenues anticipated to be received and the anticipated timing thereof, and statements regarding the amounts of total LNG regasification, natural gas, liquefaction or storage capacities that are, or may become, subject to contracts; statements regarding counterparties to our commercial contracts, construction contracts and other contracts; statements regarding our planned development and construction of additional Trains or pipelines, including the financing of such Trains or pipelines; statements that our Trains, when completed, will have certain characteristics, including amounts of liquefaction capacities; statements regarding our business strategy, our strengths, our business and operation plans or any other plans, forecasts, projections or objectives, including anticipated revenues, capital expenditures, maintenance and operating costs, run-rate SG&A estimates, cash flows, EBITDA, Adjusted EBITDA, distributable cash flow, distributable cash flow per share and unit, deconsolidated debt outstanding, and deconsolidated contracted EBITDA, any or all of which are subject to change; statements regarding projections of revenues, expenses, earnings or losses, working capital or other financial items; statements relating to the amount and timing of stock repurchases; statements regarding legislative, governmental, regulatory, administrative or other public body actions, approvals, requirements, permits, applications, filings, investigations, proceedings or decisions; statements regarding our anticipated LNG and natural gas marketing activities; and any other statements that relate to non-historical or future information. These forward-looking statements are often identified by the use of terms and phrases such as “achieve,” “anticipate,” “believe,” “contemplate,” “develop,” “estimate,” “example,” “expect,” “forecast,” “goals,” ”guidance,” “opportunities,” “plan,” “potential,” “project,” “propose,” “subject to,” “strategy,” “target,” and similar terms and phrases, or by use of future tense. Although we believe that the expectations reflected in these forward-looking statements are reasonable, they do involve assumptions, risks and uncertainties, and these expectations may prove to be incorrect. You should not place undue reliance on these forward-looking statements, which speak only as of the date of this presentation. Our actual results could differ materially from those anticipated in these forward-looking statements as a result of a variety of factors, including those discussed in “Risk Factors” in the Cheniere Energy, Inc. and Cheniere Energy Partners, L.P. Annual Reports on Form 10-K filed with the SEC on February 26, 2019, which are incorporated by reference into this presentation. All forward-looking statements attributable to us or persons acting on our behalf are expressly qualified in their entirety by these ”Risk Factors.” These forward-looking statements are made as of the date of this presentation, and other than as required by law, we undertake no obligation to update or revise any forward-looking statement or provide reasons why actual results may differ, whether as a result of new information, future events or otherwise. Reconciliation to U.S. GAAP Financial Information The following presentation includes certain “non-GAAP financial measures” as defined in Regulation G under the Securities Exchange Act of 1934, as amended. Schedules are included in the appendix hereto that reconcile the non-GAAP financial measures included in the following presentation to the most directly comparable financial measures calculated and presented in accordance with U.S. GAAP.
Agenda Introduction Randy Bhatia Vice President, Investor Relations Financial Strategy and Guidance Michael Wortley Executive Vice President and Chief Financial Officer Q & A Introduction and Vision Jack Fusco President and Chief Executive Officer Commercial Update Anatol Feygin Executive Vice President and Chief Commercial Officer
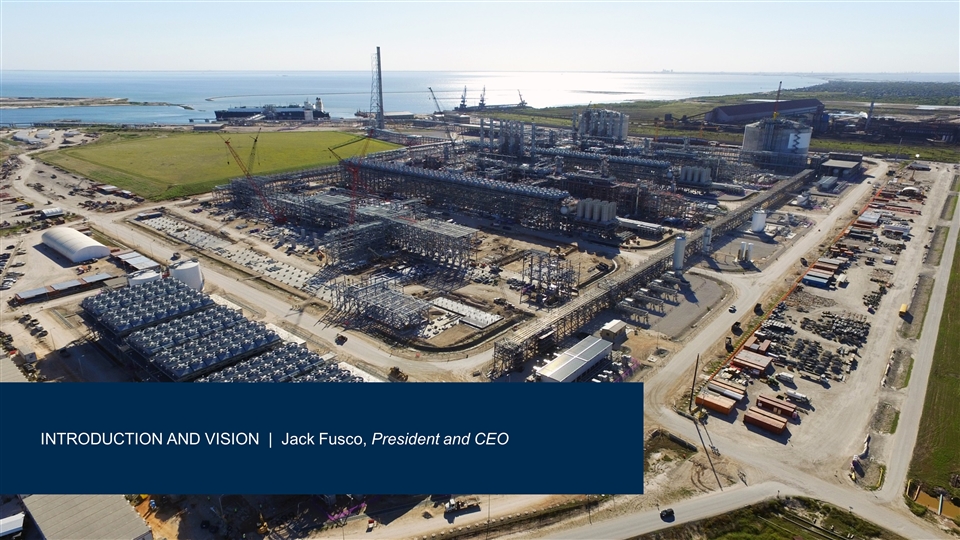
INTRODUCTION AND VISION | Jack Fusco, President and CEO
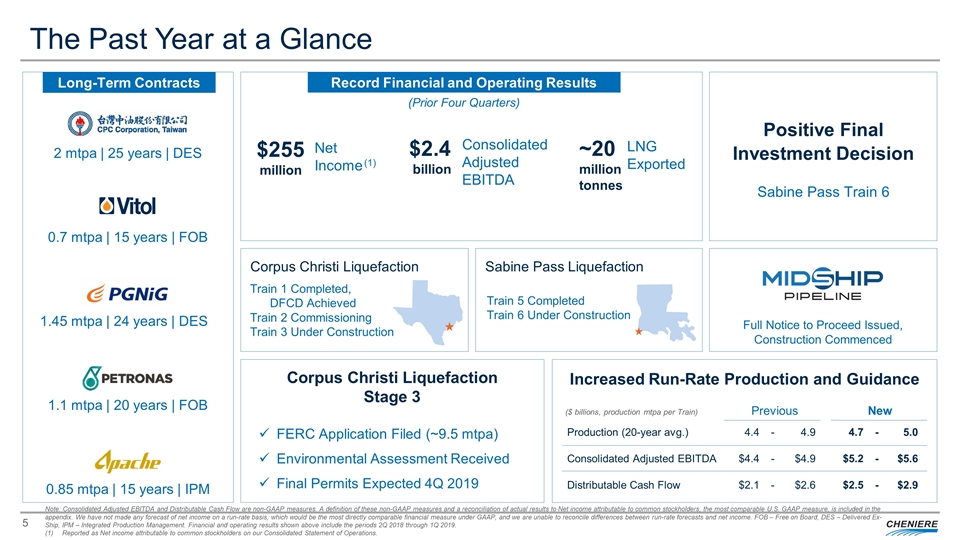
2 mtpa | 25 years | DES 0.7 mtpa | 15 years | FOB 1.45 mtpa | 24 years | DES_ 1.1 mtpa | 20 years | FOB 0.85 mtpa | 15 years | IPM Increased Run-Rate Production and Guidance The Past Year at a Glance Note: Consolidated Adjusted EBITDA and Distributable Cash Flow are non-GAAP measures. A definition of these non-GAAP measures and a reconciliation of actual results to Net income attributable to common stockholders, the most comparable U.S. GAAP measure, is included in the appendix. We have not made any forecast of net income on a run-rate basis, which would be the most directly comparable financial measure under GAAP, and we are unable to reconcile differences between run-rate forecasts and net income. FOB – Free on Board, DES – Delivered Ex-Ship, IPM – Integrated Production Management. Financial and operating results shown above include the periods 2Q 2018 through 1Q 2019. (1) Reported as Net income attributable to common stockholders on our Consolidated Statement of Operations. Corpus Christi Liquefaction Sabine Pass Liquefaction Full Notice to Proceed Issued, Construction Commenced Production (20-year avg.) 4.4 - 4.9 4.7 - 5.0 Consolidated Adjusted EBITDA $4.4 - $4.9 $5.2 - $5.6 Distributable Cash Flow $2.1 - $2.6 $2.5 - $2.9 Corpus Christi Liquefaction Stage 3 FERC Application Filed (~9.5 mtpa) Environmental Assessment Received Final Permits Expected 4Q 2019 Long-Term Contracts $255 million Net Income (1) ~20 million tonnes LNG Exported $2.4 billion Consolidated Adjusted EBITDA Positive Final Investment Decision Sabine Pass Train 6 Record Financial and Operating Results ($ billions, production mtpa per Train) Previous New (Prior Four Quarters) Train 1 Completed, DFCD Achieved Train 2 Commissioning Train 3 Under Construction Train 5 Completed Train 6 Under Construction
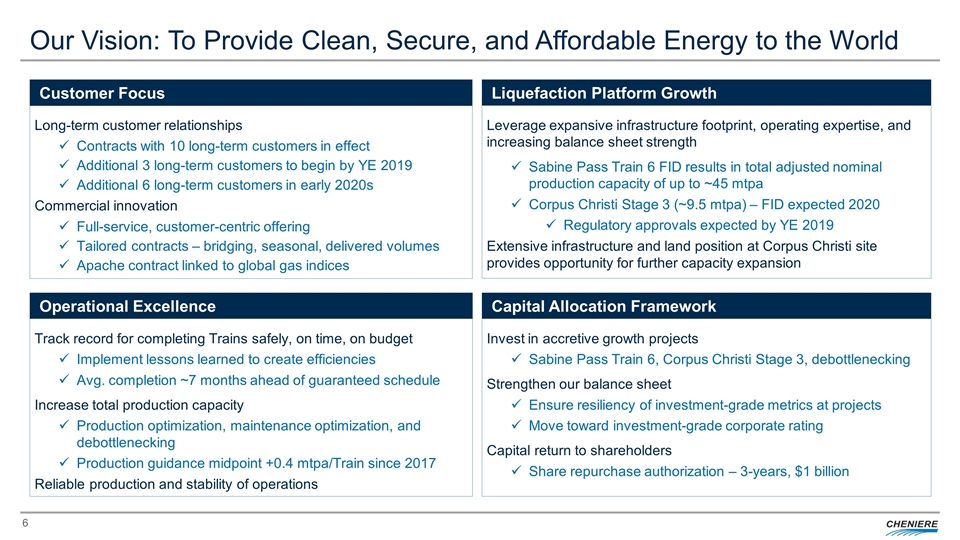
Track record for completing Trains safely, on time, on budget Implement lessons learned to create efficiencies Avg. completion ~7 months ahead of guaranteed schedule Increase total production capacity Production optimization, maintenance optimization, and debottlenecking Production guidance midpoint +0.4 mtpa/Train since 2017 Reliable production and stability of operations Our Vision: To Provide Clean, Secure, and Affordable Energy to the World Long-term customer relationships Contracts with 10 long-term customers in effect Additional 3 long-term customers to begin by YE 2019 Additional 6 long-term customers in early 2020s Commercial innovation Full-service, customer-centric offering Tailored contracts – bridging, seasonal, delivered volumes Apache contract linked to global gas indices Customer Focus Operational Excellence Leverage expansive infrastructure footprint, operating expertise, and increasing balance sheet strength Sabine Pass Train 6 FID results in total adjusted nominal production capacity of up to ~45 mtpa Corpus Christi Stage 3 (~9.5 mtpa) – FID expected 2020 Regulatory approvals expected by YE 2019 Extensive infrastructure and land position at Corpus Christi site provides opportunity for further capacity expansion Liquefaction Platform Growth Invest in accretive growth projects Sabine Pass Train 6, Corpus Christi Stage 3, debottlenecking Strengthen our balance sheet Ensure resiliency of investment-grade metrics at projects Move toward investment-grade corporate rating Capital return to shareholders Share repurchase authorization – 3-years, $1 billion Capital Allocation Framework
COMMERCIAL UPDATE | Anatol Feygin, EVP and CCO
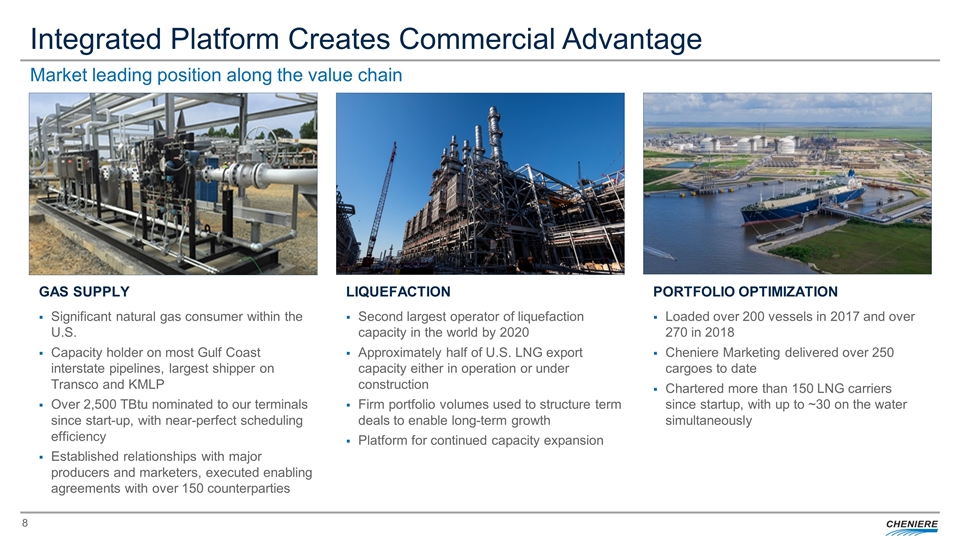
Integrated Platform Creates Commercial Advantage Market leading position along the value chain Significant natural gas consumer within the U.S. Capacity holder on most Gulf Coast interstate pipelines, largest shipper on Transco and KMLP Over 2,500 TBtu nominated to our terminals since start-up, with near-perfect scheduling efficiency Established relationships with major producers and marketers, executed enabling agreements with over 150 counterparties Second largest operator of liquefaction capacity in the world by 2020 Approximately half of U.S. LNG export capacity either in operation or under construction Firm portfolio volumes used to structure term deals to enable long-term growth Platform for continued capacity expansion Loaded over 200 vessels in 2017 and over 270 in 2018 Cheniere Marketing delivered over 250 cargoes to date Chartered more than 150 LNG carriers since startup, with up to ~30 on the water simultaneously GAS SUPPLY LIQUEFACTION PORTFOLIO OPTIMIZATION
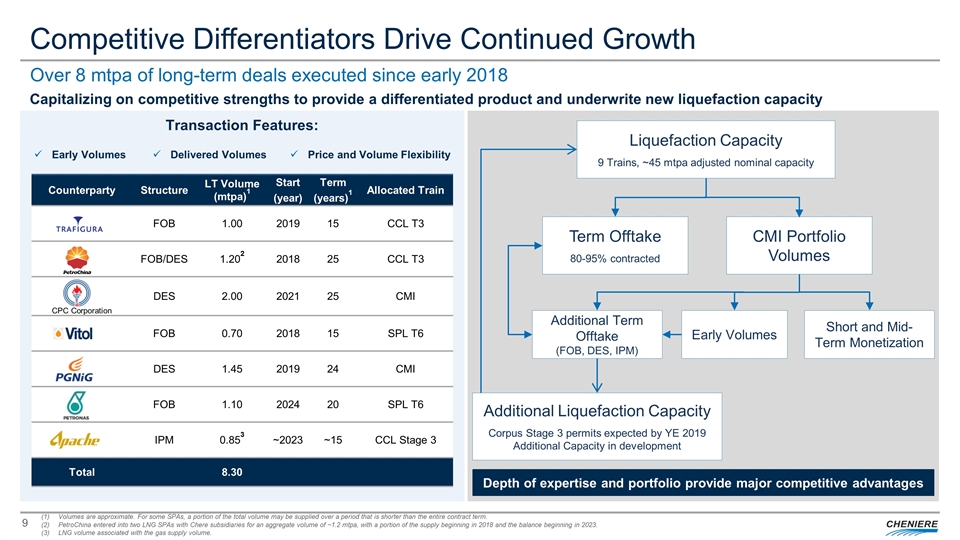
Capitalizing on competitive strengths to provide a differentiated product and underwrite new liquefaction capacity Competitive Differentiators Drive Continued Growth (1) Volumes are approximate. For some SPAs, a portion of the total volume may be supplied over a period that is shorter than the entire contract term. (2) PetroChina entered into two LNG SPAs with Chere subsidiaries for an aggregate volume of ~1.2 mtpa, with a portion of the supply beginning in 2018 and the balance beginning in 2023. (3) LNG volume associated with the gas supply volume. Counterparty Structure LT Volume (mtpa)1 Start Term Allocated Train (year) (years)1 FOB 1.00 2019 15 CCL T3 FOB/DES 1.202 2018 25 CCL T3 CPC Corporation DES 2.00 2021 25 CMI FOB 0.70 2018 15 SPL T6 DES 1.45 2019 24 CMI FOB 1.10 2024 20 SPL T6 IPM 0.853 ~2023 ~15 CCL Stage 3 Total 8.30 Over 8 mtpa of long-term deals executed since early 2018 Transaction Features: Depth of expertise and portfolio provide major competitive advantages Delivered Volumes Price and Volume Flexibility Early Volumes Liquefaction Capacity 9 Trains, ~45 mtpa adjusted nominal capacity Additional Liquefaction Capacity Corpus Stage 3 permits expected by YE 2019 Additional Capacity in development Early Volumes Additional Term Offtake (FOB, DES, IPM) Short and Mid-Term Monetization Term Offtake 80-95% contracted CMI Portfolio Volumes
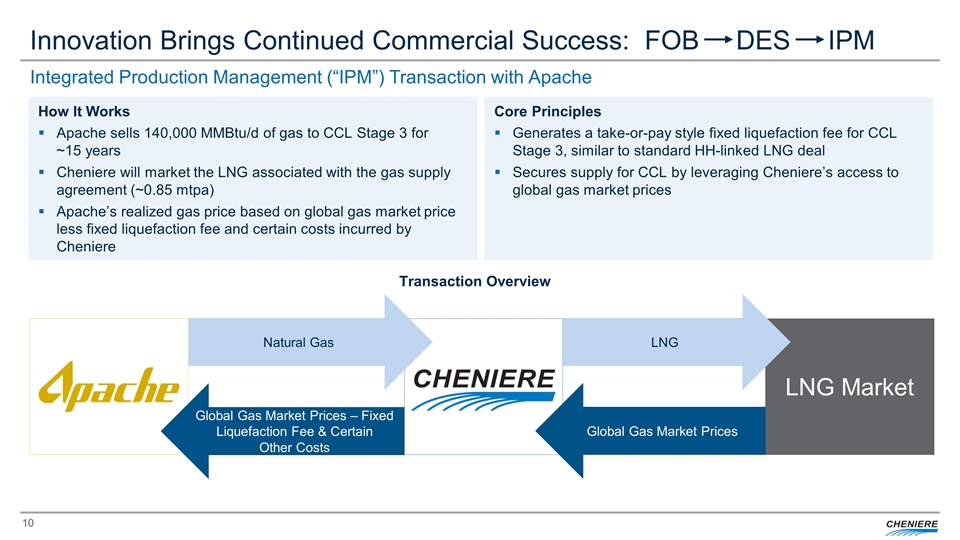
How It Works Apache sells 140,000 MMBtu/d of gas to CCL Stage 3 for ~15 years Cheniere will market the LNG associated with the gas supply agreement (~0.85 mtpa) Apache’s realized gas price based on global gas market price less fixed liquefaction fee and certain costs incurred by Cheniere Core Principles Generates a take-or-pay style fixed liquefaction fee for CCL Stage 3, similar to standard HH-linked LNG deal Secures supply for CCL by leveraging Cheniere’s access to global gas market prices Innovation Brings Continued Commercial Success: FOB DES IPM Transaction Overview Integrated Production Management (“IPM”) Transaction with Apache LNG Market Natural Gas Global Gas Market Prices – Fixed Liquefaction Fee & Certain Other Costs LNG Global Gas Market Prices
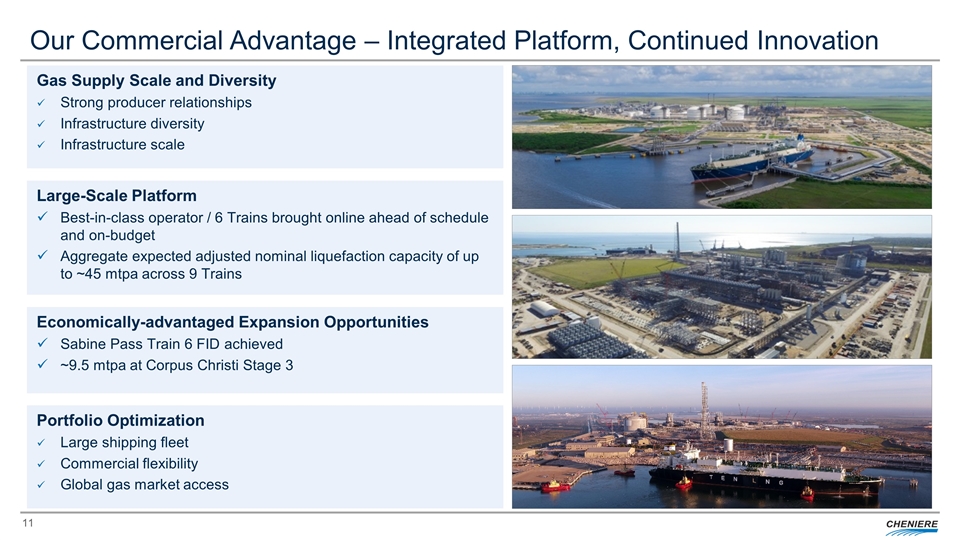
Our Commercial Advantage – Integrated Platform, Continued Innovation Gas Supply Scale and Diversity Strong producer relationships Infrastructure diversity Infrastructure scale Large-Scale Platform Best-in-class operator / 6 Trains brought online ahead of schedule and on-budget Aggregate expected adjusted nominal liquefaction capacity of up to ~45 mtpa across 9 Trains Portfolio Optimization Large shipping fleet Commercial flexibility Global gas market access Economically-advantaged Expansion Opportunities Sabine Pass Train 6 FID achieved ~9.5 mtpa at Corpus Christi Stage 3
FINANCIAL STRATEGY AND GUIDANCE | Michael Wortley, EVP and CFO
2019 Investor Update Financial Priorities SPL Train 6 Financing Run-Rate Guidance Update Capital Allocation
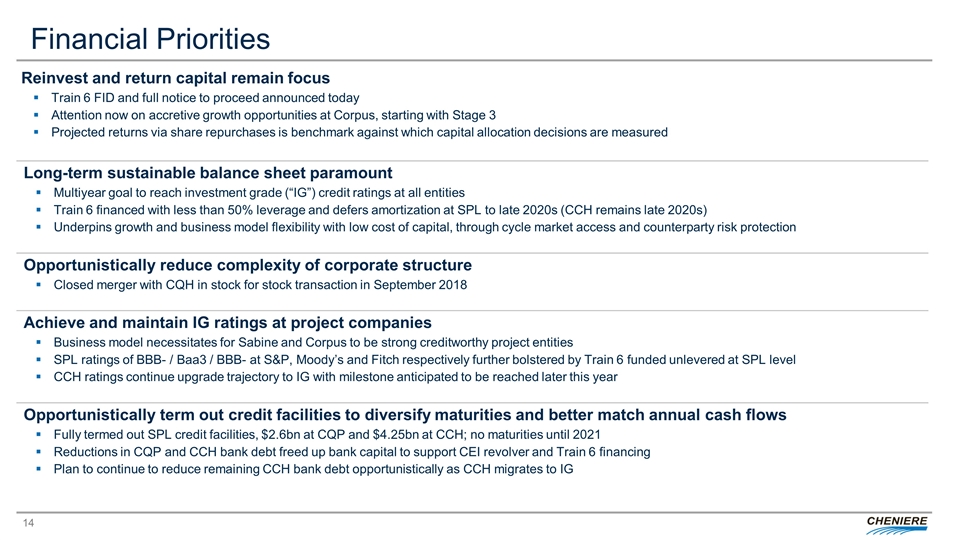
Reinvest and return capital remain focus Train 6 FID and full notice to proceed announced today Attention now on accretive growth opportunities at Corpus, starting with Stage 3 Projected returns via share repurchases is benchmark against which capital allocation decisions are measured Long-term sustainable balance sheet paramount Multiyear goal to reach investment grade (“IG”) credit ratings at all entities Train 6 financed with less than 50% leverage and defers amortization at SPL to late 2020s (CCH remains late 2020s) Underpins growth and business model flexibility with low cost of capital, through cycle market access and counterparty risk protection Opportunistically reduce complexity of corporate structure Closed merger with CQH in stock for stock transaction in September 2018 Achieve and maintain IG ratings at project companies Business model necessitates for Sabine and Corpus to be strong creditworthy project entities SPL ratings of BBB- / Baa3 / BBB- at S&P, Moody’s and Fitch respectively further bolstered by Train 6 funded unlevered at SPL level CCH ratings continue upgrade trajectory to IG with milestone anticipated to be reached later this year Opportunistically term out credit facilities to diversify maturities and better match annual cash flows Fully termed out SPL credit facilities, $2.6bn at CQP and $4.25bn at CCH; no maturities until 2021 Reductions in CQP and CCH bank debt freed up bank capital to support CEI revolver and Train 6 financing Plan to continue to reduce remaining CCH bank debt opportunistically as CCH migrates to IG Financial Priorities
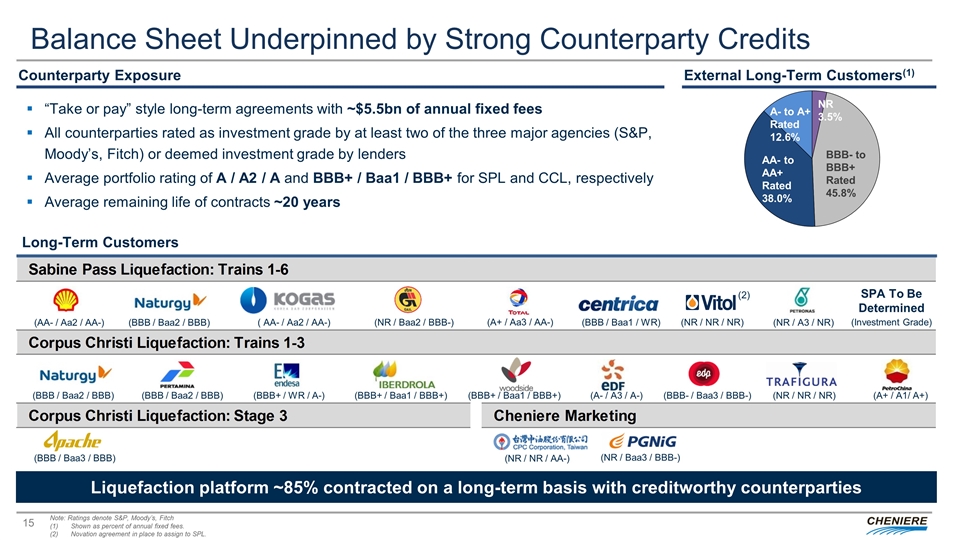
Long-Term Customers Balance Sheet Underpinned by Strong Counterparty Credits Counterparty Exposure External Long-Term Customers(1) Note: Ratings denote S&P, Moody’s, Fitch (1) Shown as percent of annual fixed fees. (2) Novation agreement in place to assign to SPL. (BBB / Baa2 / BBB) (NR / Baa2 / BBB-) ( AA- / Aa2 / AA-) (A+ / Aa3 / AA-) (BBB / Baa1 / WR) (AA- / Aa2 / AA-) (BBB / Baa2 / BBB) (BBB+ / Baa1 / BBB+) (BBB+ / WR / A-) (BBB+ / Baa1 / BBB+) (A- / A3 / A-) (BBB / Baa2 / BBB) (BBB- / Baa3 / BBB-) (A+ / A1/ A+) (NR / NR / NR) (NR / NR / NR) (NR / A3 / NR) AA- to AA+ Rated 38.0% BBB- to BBB+ Rated 45.8% NR 3.5% A- to A+ Rated 12.6% (Investment Grade) SPA To Be Determined “Take or pay” style long-term agreements with ~$5.5bn of annual fixed fees All counterparties rated as investment grade by at least two of the three major agencies (S&P, Moody’s, Fitch) or deemed investment grade by lenders Average portfolio rating of A / A2 / A and BBB+ / Baa1 / BBB+ for SPL and CCL, respectively Average remaining life of contracts ~20 years (NR / NR / AA-) (NR / Baa3 / BBB-) (2) (BBB / Baa3 / BBB) Liquefaction platform ~85% contracted on a long-term basis with creditworthy counterparties
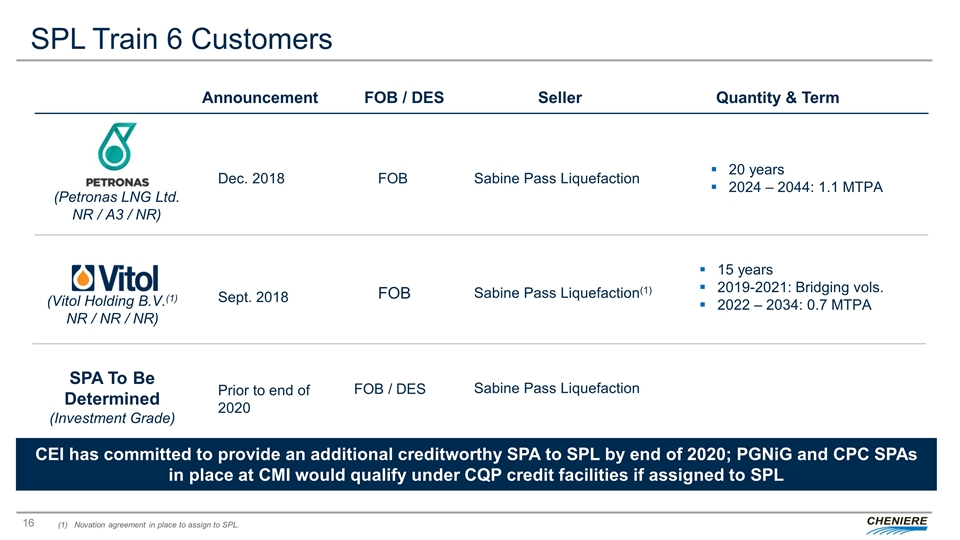
SPL Train 6 Customers (1) Novation agreement in place to assign to SPL. Announcement FOB / DES Seller Quantity & Term Sabine Pass Liquefaction Dec. 2018 FOB 20 years 2024 – 2044: 1.1 MTPA Prior to end of 2020 FOB / DES Sabine Pass Liquefaction 15 years 2019-2021: Bridging vols. 2022 – 2034: 0.7 MTPA Sabine Pass Liquefaction(1) FOB Sept. 2018 SPA To Be Determined (Investment Grade) (Vitol Holding B.V.(1) NR / NR / NR) (Petronas LNG Ltd. NR / A3 / NR) CEI has committed to provide an additional creditworthy SPA to SPL by end of 2020; PGNiG and CPC SPAs in place at CMI would qualify under CQP credit facilities if assigned to SPL
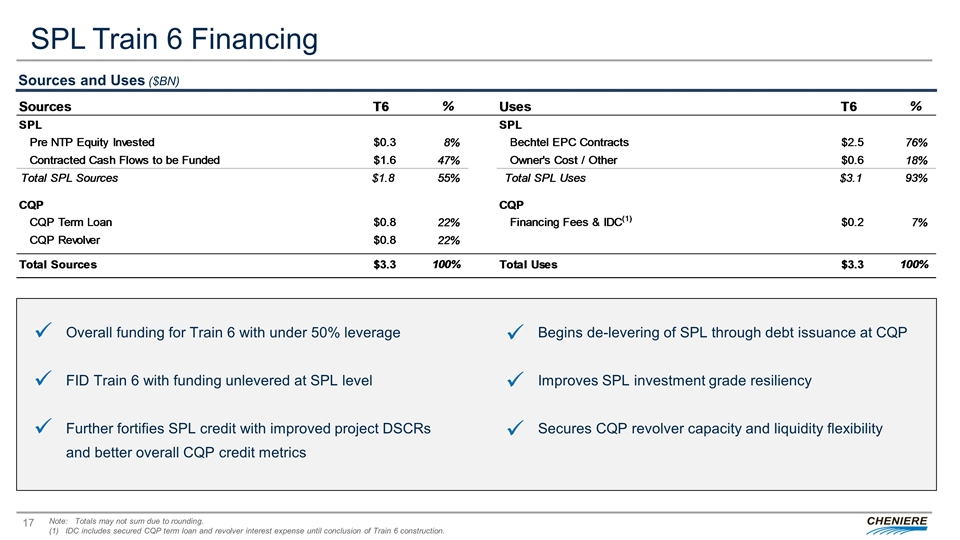
SPL Train 6 Financing Note: Totals may not sum due to rounding. (1) IDC includes secured CQP term loan and revolver interest expense until conclusion of Train 6 construction. Sources and Uses ($BN) Overall funding for Train 6 with under 50% leverage FID Train 6 with funding unlevered at SPL level Further fortifies SPL credit with improved project DSCRs and better overall CQP credit metrics Begins de-levering of SPL through debt issuance at CQP Improves SPL investment grade resiliency Secures CQP revolver capacity and liquidity flexibility ü ü ü ü ü ü
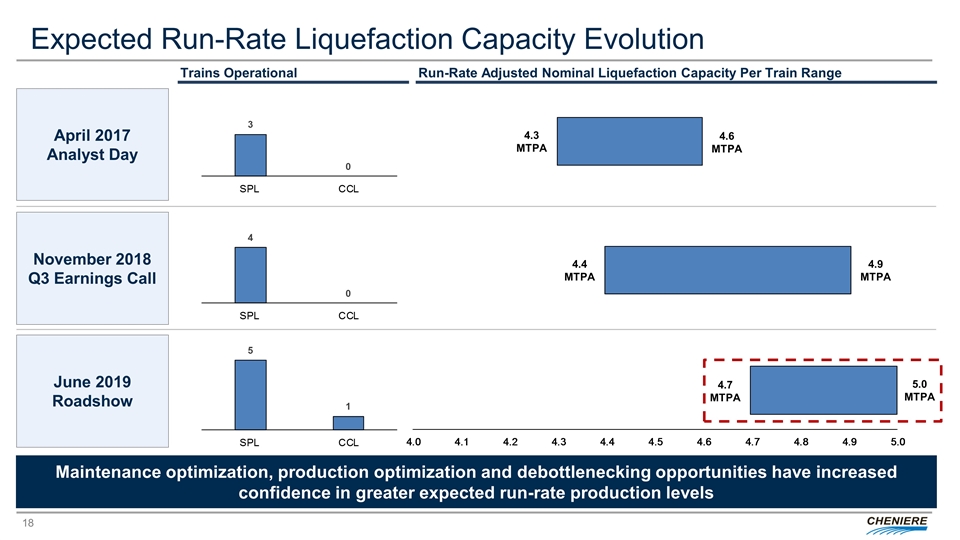
Expected Run-Rate Liquefaction Capacity Evolution Run-Rate Adjusted Nominal Liquefaction Capacity Per Train Range April 2017 Analyst Day Maintenance optimization, production optimization and debottlenecking opportunities have increased confidence in greater expected run-rate production levels November 2018 Q3 Earnings Call June 2019 Roadshow Trains Operational 4.3 MTPA 4.6 MTPA 4.4 MTPA 4.9 MTPA 5.0 MTPA 4.7 MTPA
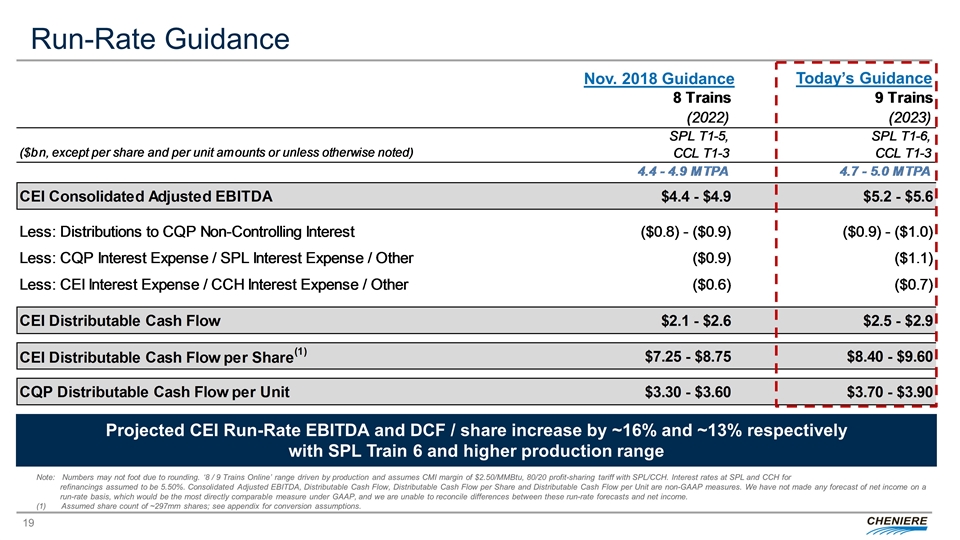
Note: Numbers may not foot due to rounding. ‘8 / 9 Trains Online’ range driven by production and assumes CMI margin of $2.50/MMBtu, 80/20 profit-sharing tariff with SPL/CCH. Interest rates at SPL and CCH for refinancings assumed to be 5.50%. Consolidated Adjusted EBITDA, Distributable Cash Flow, Distributable Cash Flow per Share and Distributable Cash Flow per Unit are non-GAAP measures. We have not made any forecast of net income on a run-rate basis, which would be the most directly comparable measure under GAAP, and we are unable to reconcile differences between these run-rate forecasts and net income. (1) Assumed share count of ~297mm shares; see appendix for conversion assumptions. Projected CEI Run-Rate EBITDA and DCF / share increase by ~16% and ~13% respectively with SPL Train 6 and higher production range Nov. 2018 Guidance Today’s Guidance Run-Rate Guidance
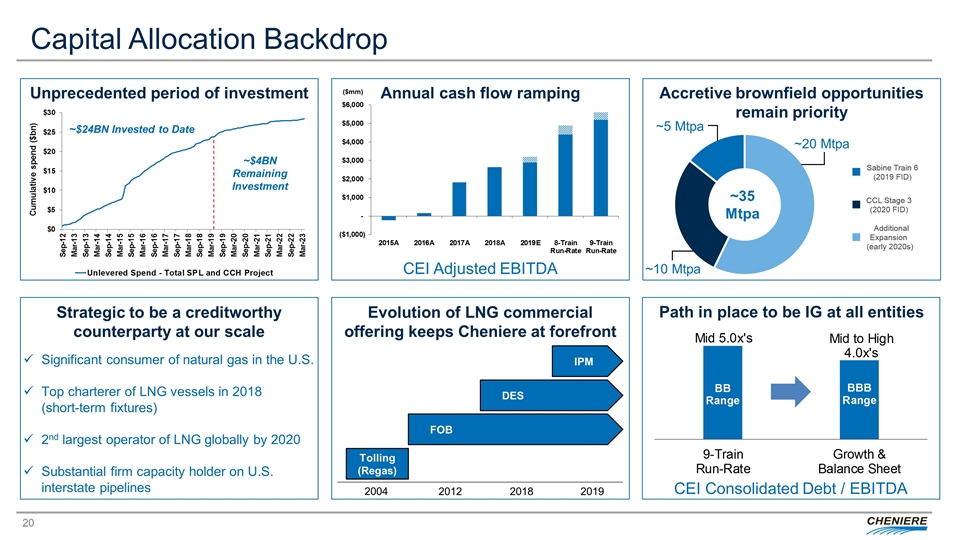
Capital Allocation Backdrop Significant consumer of natural gas in the U.S. Top charterer of LNG vessels in 2018 (short-term fixtures) 2nd largest operator of LNG globally by 2020 Substantial firm capacity holder on U.S. interstate pipelines Path in place to be IG at all entities Annual cash flow ramping Accretive brownfield opportunities remain priority Unprecedented period of investment CEI Adjusted EBITDA CEI Consolidated Debt / EBITDA ~$24BN Invested to Date ~$4BN Remaining Investment ~35 Mtpa ~5 Mtpa ~10 Mtpa ~20 Mtpa ($mm) Evolution of LNG commercial offering keeps Cheniere at forefront 2004 2012 2018 2019 FOB DES IPM Tolling (Regas) Strategic to be a creditworthy counterparty at our scale
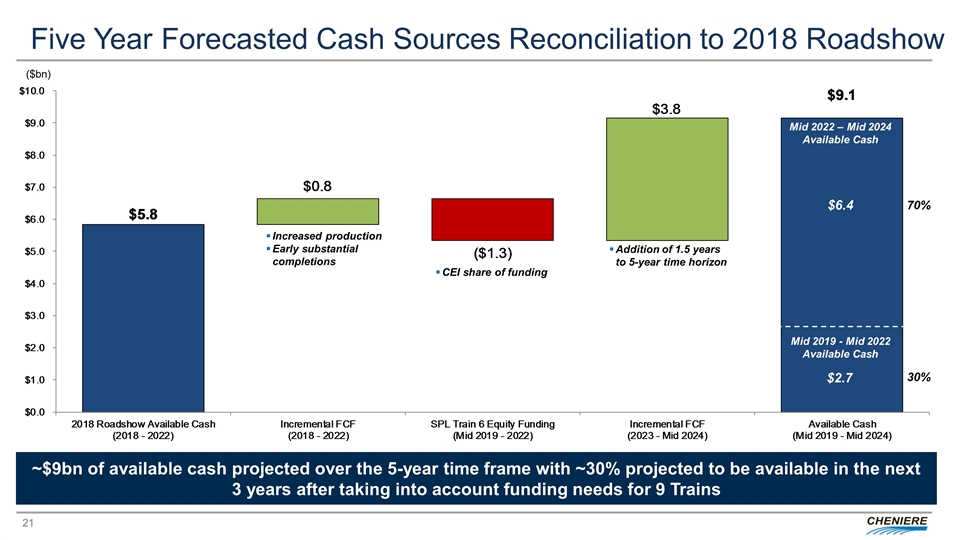
Five Year Forecasted Cash Sources Reconciliation to 2018 Roadshow ~$9bn of available cash projected over the 5-year time frame with ~30% projected to be available in the next 3 years after taking into account funding needs for 9 Trains Mid 2022 – Mid 2024 Available Cash Increased production Early substantial completions Addition of 1.5 years to 5-year time horizon ($bn) $2.7 $6.4 Mid 2019 - Mid 2022 Available Cash 70% 30% CEI share of funding
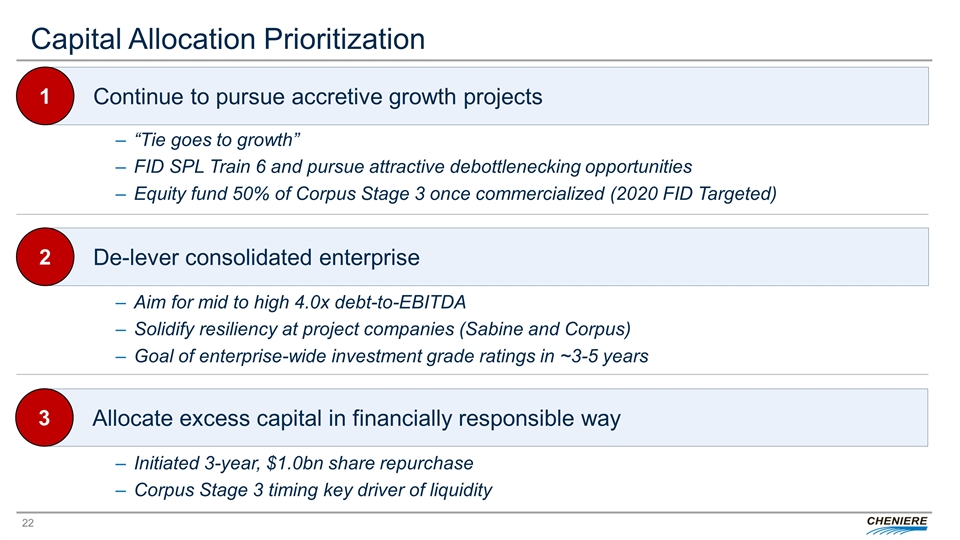
Continue to pursue accretive growth projects Capital Allocation Prioritization 1 De-lever consolidated enterprise 2 Aim for mid to high 4.0x debt-to-EBITDA Solidify resiliency at project companies (Sabine and Corpus) Goal of enterprise-wide investment grade ratings in ~3-5 years Allocate excess capital in financially responsible way 3 “Tie goes to growth” FID SPL Train 6 and pursue attractive debottlenecking opportunities Equity fund 50% of Corpus Stage 3 once commercialized (2020 FID Targeted) Initiated 3-year, $1.0bn share repurchase Corpus Stage 3 timing key driver of liquidity
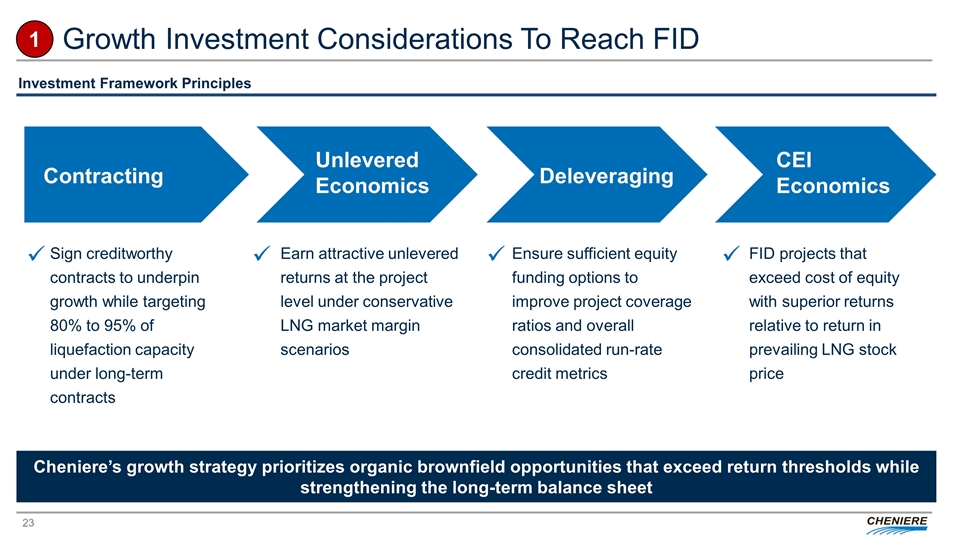
Growth Investment Considerations To Reach FID 1 Investment Framework Principles ü Contracting Unlevered Economics Deleveraging CEI Economics Sign creditworthy contracts to underpin growth while targeting 80% to 95% of liquefaction capacity under long-term contracts Earn attractive unlevered returns at the project level under conservative LNG market margin scenarios Ensure sufficient equity funding options to improve project coverage ratios and overall consolidated run-rate credit metrics FID projects that exceed cost of equity with superior returns relative to return in prevailing LNG stock price ü ü ü Cheniere’s growth strategy prioritizes organic brownfield opportunities that exceed return thresholds while strengthening the long-term balance sheet
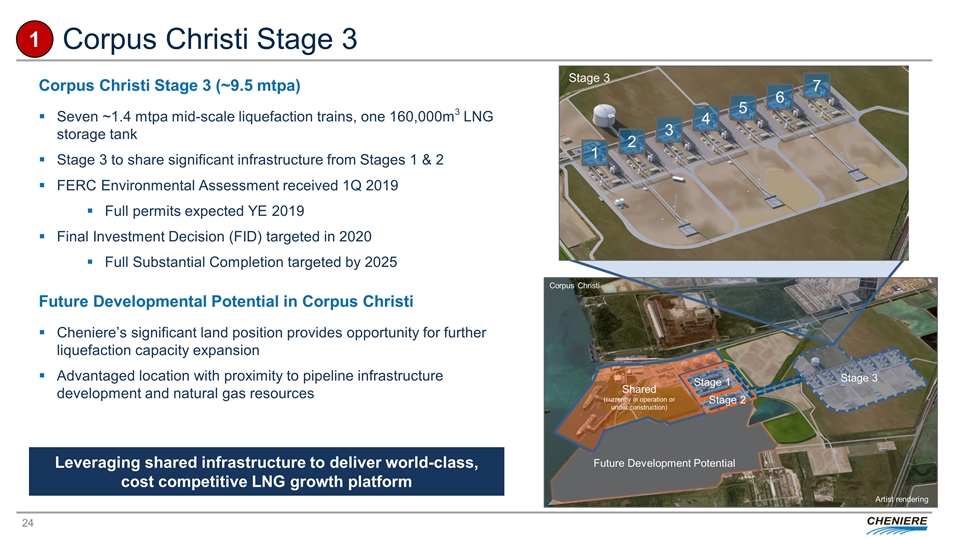
Corpus Christi Stage 3 Stage 3 Future Development Potential Shared (currently in operation or under construction) Stage 1 Stage 2 Corpus Christi Artist rendering Stage 3 Corpus Christi Stage 3 (~9.5 mtpa) Seven ~1.4 mtpa mid-scale liquefaction trains, one 160,000m3 LNG storage tank Stage 3 to share significant infrastructure from Stages 1 & 2 FERC Environmental Assessment received 1Q 2019 Full permits expected YE 2019 Final Investment Decision (FID) targeted in 2020 Full Substantial Completion targeted by 2025 Future Developmental Potential in Corpus Christi Cheniere’s significant land position provides opportunity for further liquefaction capacity expansion Advantaged location with proximity to pipeline infrastructure development and natural gas resources Leveraging shared infrastructure to deliver world-class, cost competitive LNG growth platform 1
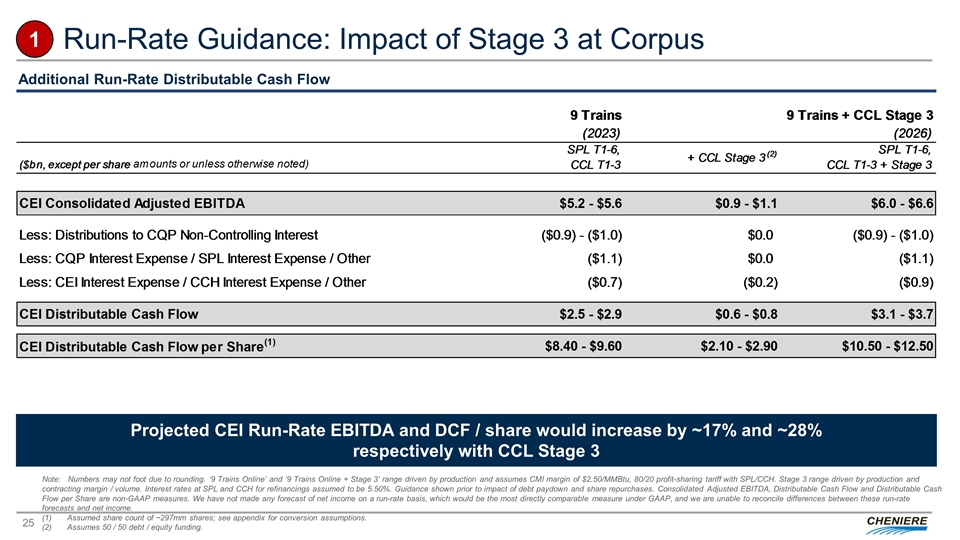
Run-Rate Guidance: Impact of Stage 3 at Corpus Additional Run-Rate Distributable Cash Flow Projected CEI Run-Rate EBITDA and DCF / share would increase by ~17% and ~28% respectively with CCL Stage 3 Note: Numbers may not foot due to rounding. ‘9 Trains Online’ and ‘9 Trains Online + Stage 3’ range driven by production and assumes CMI margin of $2.50/MMBtu, 80/20 profit-sharing tariff with SPL/CCH. Stage 3 range driven by production and contracting margin / volume. Interest rates at SPL and CCH for refinancings assumed to be 5.50%. Guidance shown prior to impact of debt paydown and share repurchases. Consolidated Adjusted EBITDA, Distributable Cash Flow and Distributable Cash Flow per Share are non-GAAP measures. We have not made any forecast of net income on a run-rate basis, which would be the most directly comparable measure under GAAP, and we are unable to reconcile differences between these run-rate forecasts and net income. (1) Assumed share count of ~297mm shares; see appendix for conversion assumptions. (2) Assumes 50 / 50 debt / equity funding. 1
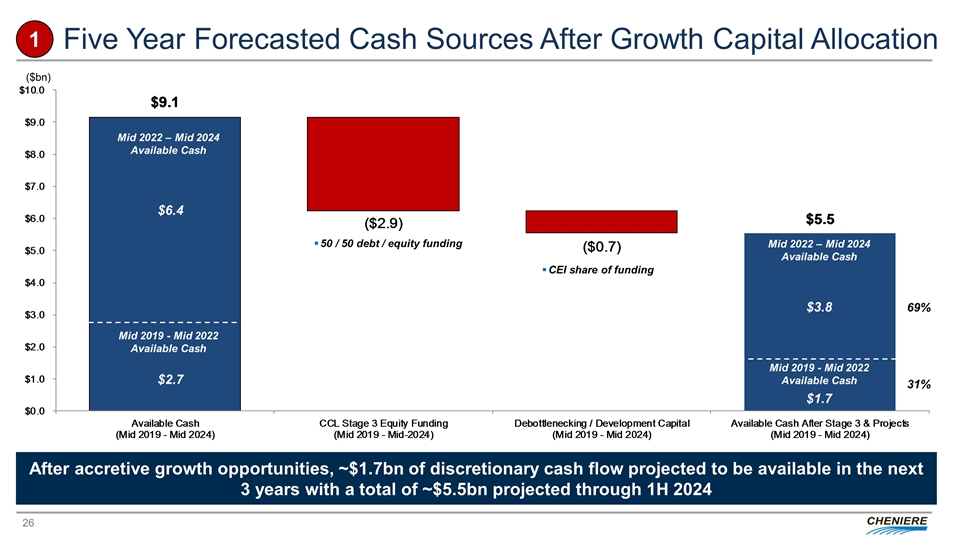
Five Year Forecasted Cash Sources After Growth Capital Allocation After accretive growth opportunities, ~$1.7bn of discretionary cash flow projected to be available in the next 3 years with a total of ~$5.5bn projected through 1H 2024 50 / 50 debt / equity funding ($bn) $2.7 $6.4 Mid 2019 - Mid 2022 Available Cash Mid 2022 – Mid 2024 Available Cash Mid 2019 - Mid 2022 Available Cash $1.7 Mid 2022 – Mid 2024 Available Cash $3.8 69% 31% 1 CEI share of funding
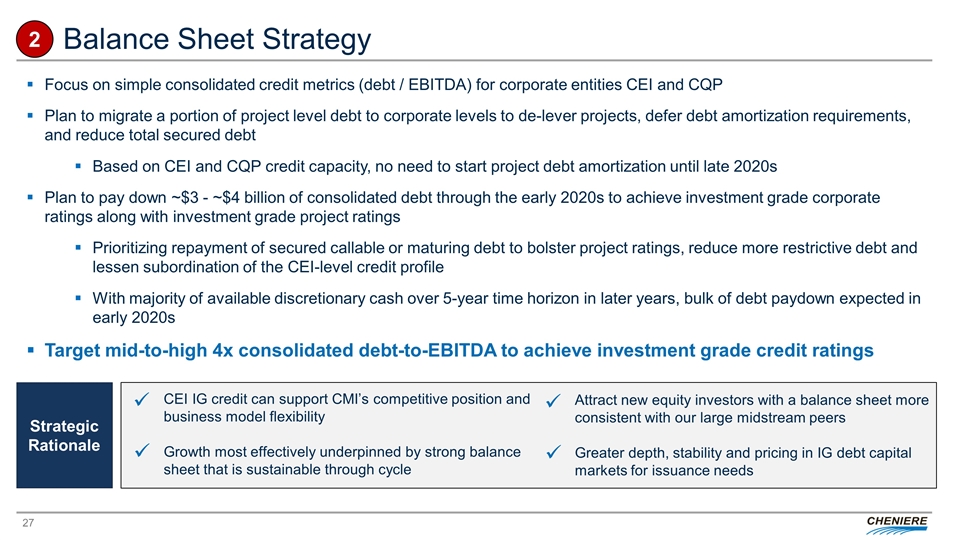
Balance Sheet Strategy Focus on simple consolidated credit metrics (debt / EBITDA) for corporate entities CEI and CQP Plan to migrate a portion of project level debt to corporate levels to de-lever projects, defer debt amortization requirements, and reduce total secured debt Based on CEI and CQP credit capacity, no need to start project debt amortization until late 2020s Plan to pay down ~$3 - ~$4 billion of consolidated debt through the early 2020s to achieve investment grade corporate ratings along with investment grade project ratings Prioritizing repayment of secured callable or maturing debt to bolster project ratings, reduce more restrictive debt and lessen subordination of the CEI-level credit profile With majority of available discretionary cash over 5-year time horizon in later years, bulk of debt paydown expected in early 2020s Target mid-to-high 4x consolidated debt-to-EBITDA to achieve investment grade credit ratings 2 CEI IG credit can support CMI’s competitive position and business model flexibility Growth most effectively underpinned by strong balance sheet that is sustainable through cycle Attract new equity investors with a balance sheet more consistent with our large midstream peers Greater depth, stability and pricing in IG debt capital markets for issuance needs ü ü ü ü Strategic Rationale
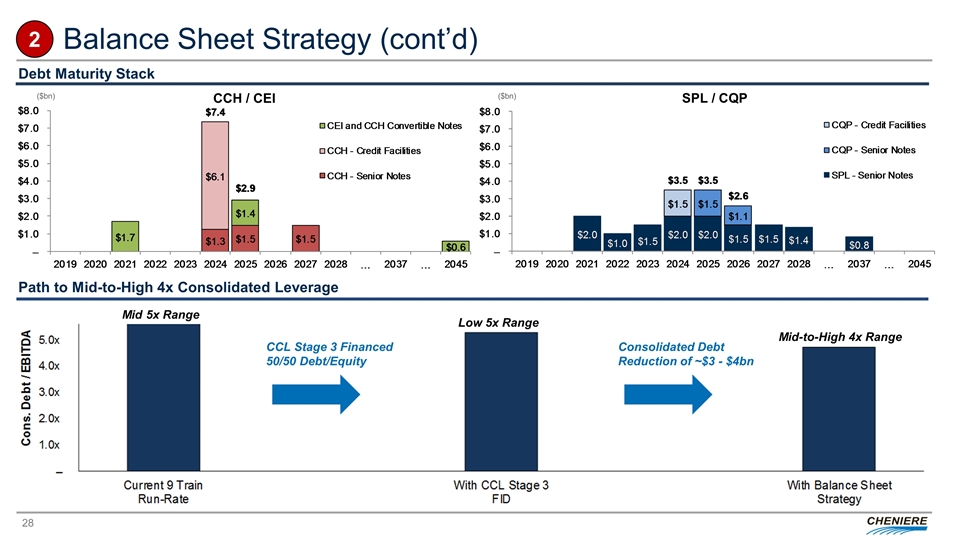
Debt Maturity Stack Path to Mid-to-High 4x Consolidated Leverage Mid 5x Range CCL Stage 3 Financed 50/50 Debt/Equity Consolidated Debt Reduction of ~$3 - $4bn Low 5x Range Mid-to-High 4x Range 2 CCH / CEI SPL / CQP Balance Sheet Strategy (cont’d) ($bn) ($bn)
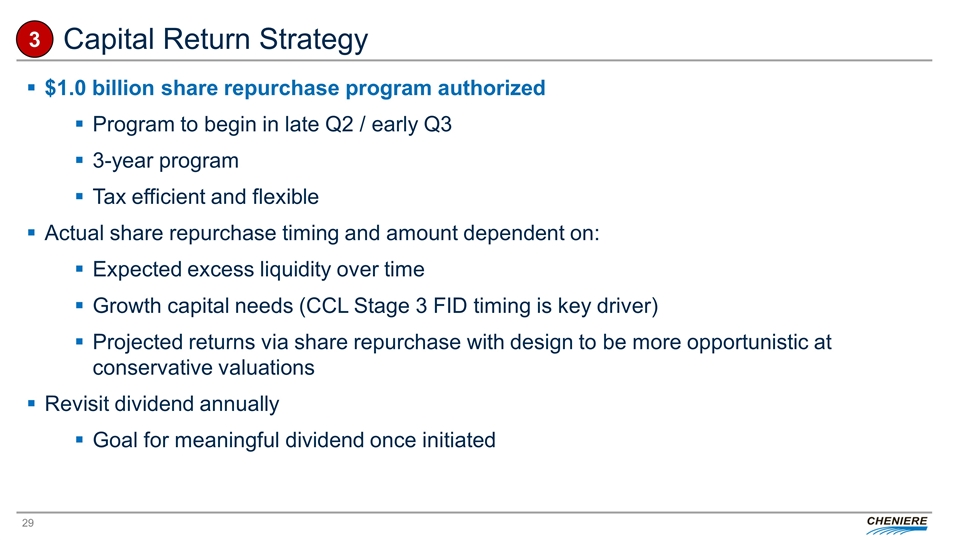
3 Capital Return Strategy $1.0 billion share repurchase program authorized Program to begin in late Q2 / early Q3 3-year program Tax efficient and flexible Actual share repurchase timing and amount dependent on: Expected excess liquidity over time Growth capital needs (CCL Stage 3 FID timing is key driver) Projected returns via share repurchase with design to be more opportunistic at conservative valuations Revisit dividend annually Goal for meaningful dividend once initiated
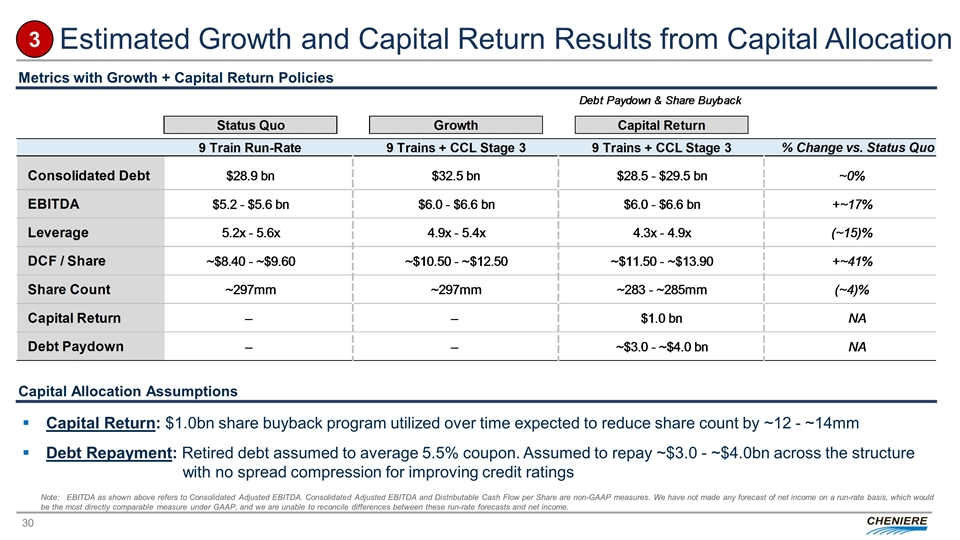
Estimated Growth and Capital Return Results from Capital Allocation Metrics with Growth + Capital Return Policies Capital Allocation Assumptions Capital Return: $1.0bn share buyback program utilized over time expected to reduce share count by ~12 - ~14mm Debt Repayment: Retired debt assumed to average 5.5% coupon. Assumed to repay ~$3.0 - ~$4.0bn across the structure with no spread compression for improving credit ratings 3 Note: EBITDA as shown above refers to Consolidated Adjusted EBITDA. Consolidated Adjusted EBITDA and Distributable Cash Flow per Share are non-GAAP measures. We have not made any forecast of net income on a run-rate basis, which would be the most directly comparable measure under GAAP, and we are unable to reconcile differences between these run-rate forecasts and net income.
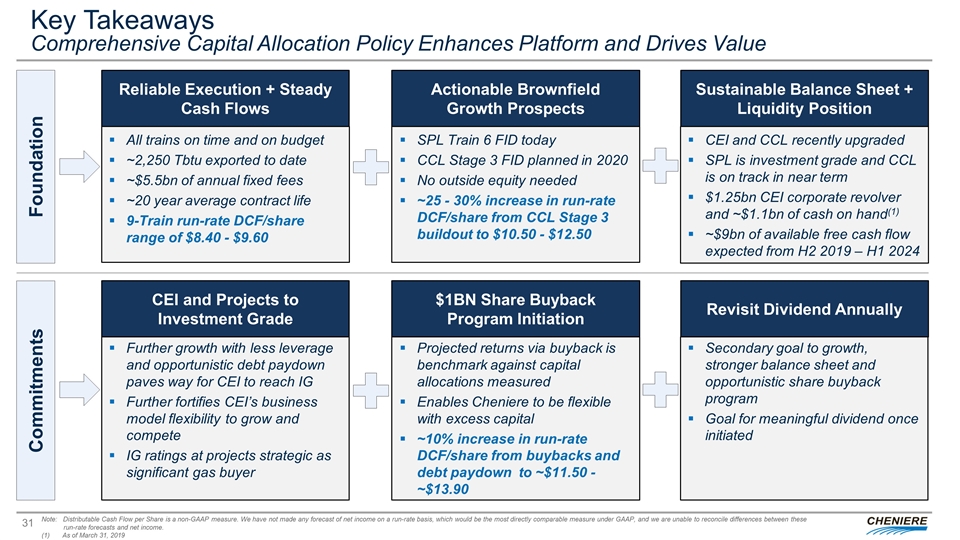
Key Takeaways Comprehensive Capital Allocation Policy Enhances Platform and Drives Value All trains on time and on budget ~2,250 Tbtu exported to date ~$5.5bn of annual fixed fees ~20 year average contract life 9-Train run-rate DCF/share range of $8.40 - $9.60 Reliable Execution + Steady Cash Flows Actionable Brownfield Growth Prospects Sustainable Balance Sheet + Liquidity Position SPL Train 6 FID today CCL Stage 3 FID planned in 2020 No outside equity needed ~25 - 30% increase in run-rate DCF/share from CCL Stage 3 buildout to $10.50 - $12.50 CEI and CCL recently upgraded SPL is investment grade and CCL is on track in near term $1.25bn CEI corporate revolver and ~$1.1bn of cash on hand(1) ~$9bn of available free cash flow expected from H2 2019 – H1 2024 Further growth with less leverage and opportunistic debt paydown paves way for CEI to reach IG Further fortifies CEI’s business model flexibility to grow and compete IG ratings at projects strategic as significant gas buyer CEI and Projects to Investment Grade $1BN Share Buyback Program Initiation Revisit Dividend Annually Projected returns via buyback is benchmark against capital allocations measured Enables Cheniere to be flexible with excess capital ~10% increase in run-rate DCF/share from buybacks and debt paydown to ~$11.50 - ~$13.90 Secondary goal to growth, stronger balance sheet and opportunistic share buyback program Goal for meaningful dividend once initiated Foundation Commitments Note: Distributable Cash Flow per Share is a non-GAAP measure. We have not made any forecast of net income on a run-rate basis, which would be the most directly comparable measure under GAAP, and we are unable to reconcile differences between these run-rate forecasts and net income. (1) As of March 31, 2019
APPENDIX
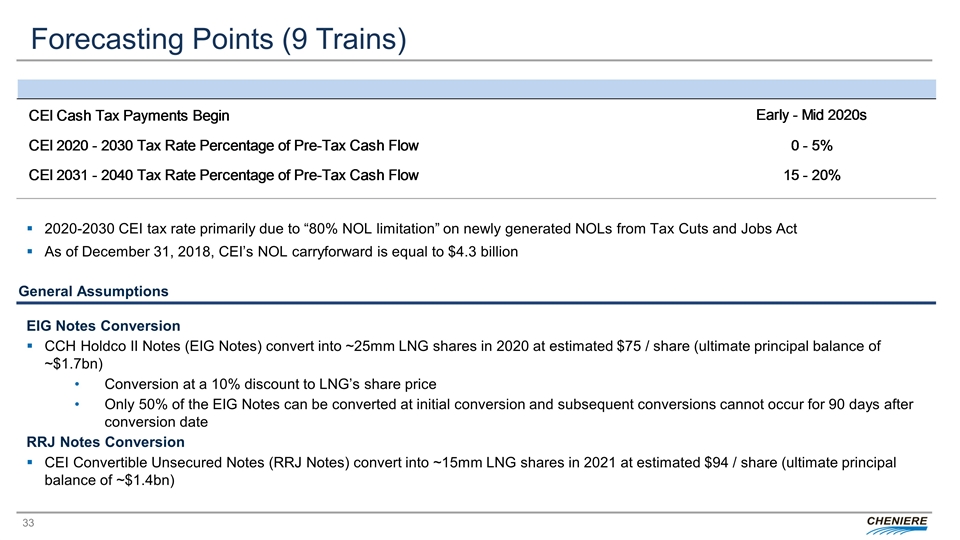
Forecasting Points (9 Trains) EIG Notes Conversion CCH Holdco II Notes (EIG Notes) convert into ~25mm LNG shares in 2020 at estimated $75 / share (ultimate principal balance of ~$1.7bn) Conversion at a 10% discount to LNG’s share price Only 50% of the EIG Notes can be converted at initial conversion and subsequent conversions cannot occur for 90 days after conversion date RRJ Notes Conversion CEI Convertible Unsecured Notes (RRJ Notes) convert into ~15mm LNG shares in 2021 at estimated $94 / share (ultimate principal balance of ~$1.4bn) General Assumptions 2020-2030 CEI tax rate primarily due to “80% NOL limitation” on newly generated NOLs from Tax Cuts and Jobs Act As of December 31, 2018, CEI’s NOL carryforward is equal to $4.3 billion
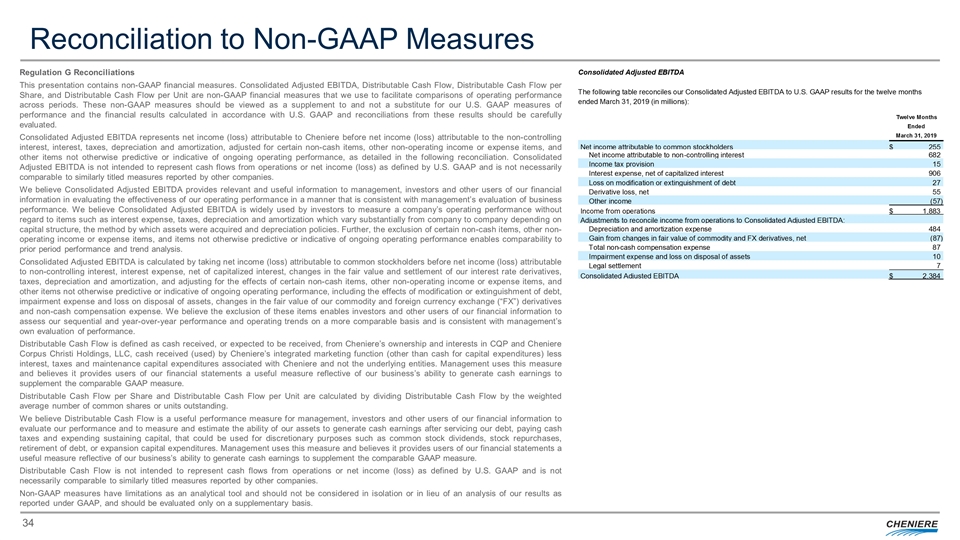
Reconciliation to Non-GAAP Measures Regulation G Reconciliations This presentation contains non-GAAP financial measures. Consolidated Adjusted EBITDA, Distributable Cash Flow, Distributable Cash Flow per Share, and Distributable Cash Flow per Unit are non-GAAP financial measures that we use to facilitate comparisons of operating performance across periods. These non-GAAP measures should be viewed as a supplement to and not a substitute for our U.S. GAAP measures of performance and the financial results calculated in accordance with U.S. GAAP and reconciliations from these results should be carefully evaluated. Consolidated Adjusted EBITDA represents net income (loss) attributable to Cheniere before net income (loss) attributable to the non-controlling interest, interest, taxes, depreciation and amortization, adjusted for certain non-cash items, other non-operating income or expense items, and other items not otherwise predictive or indicative of ongoing operating performance, as detailed in the following reconciliation. Consolidated Adjusted EBITDA is not intended to represent cash flows from operations or net income (loss) as defined by U.S. GAAP and is not necessarily comparable to similarly titled measures reported by other companies. We believe Consolidated Adjusted EBITDA provides relevant and useful information to management, investors and other users of our financial information in evaluating the effectiveness of our operating performance in a manner that is consistent with management’s evaluation of business performance. We believe Consolidated Adjusted EBITDA is widely used by investors to measure a company’s operating performance without regard to items such as interest expense, taxes, depreciation and amortization which vary substantially from company to company depending on capital structure, the method by which assets were acquired and depreciation policies. Further, the exclusion of certain non-cash items, other non-operating income or expense items, and items not otherwise predictive or indicative of ongoing operating performance enables comparability to prior period performance and trend analysis. Consolidated Adjusted EBITDA is calculated by taking net income (loss) attributable to common stockholders before net income (loss) attributable to non-controlling interest, interest expense, net of capitalized interest, changes in the fair value and settlement of our interest rate derivatives, taxes, depreciation and amortization, and adjusting for the effects of certain non-cash items, other non-operating income or expense items, and other items not otherwise predictive or indicative of ongoing operating performance, including the effects of modification or extinguishment of debt, impairment expense and loss on disposal of assets, changes in the fair value of our commodity and foreign currency exchange (“FX”) derivatives and non-cash compensation expense. We believe the exclusion of these items enables investors and other users of our financial information to assess our sequential and year-over-year performance and operating trends on a more comparable basis and is consistent with management’s own evaluation of performance. Distributable Cash Flow is defined as cash received, or expected to be received, from Cheniere’s ownership and interests in CQP and Cheniere Corpus Christi Holdings, LLC, cash received (used) by Cheniere’s integrated marketing function (other than cash for capital expenditures) less interest, taxes and maintenance capital expenditures associated with Cheniere and not the underlying entities. Management uses this measure and believes it provides users of our financial statements a useful measure reflective of our business’s ability to generate cash earnings to supplement the comparable GAAP measure. Distributable Cash Flow per Share and Distributable Cash Flow per Unit are calculated by dividing Distributable Cash Flow by the weighted average number of common shares or units outstanding. We believe Distributable Cash Flow is a useful performance measure for management, investors and other users of our financial information to evaluate our performance and to measure and estimate the ability of our assets to generate cash earnings after servicing our debt, paying cash taxes and expending sustaining capital, that could be used for discretionary purposes such as common stock dividends, stock repurchases, retirement of debt, or expansion capital expenditures. Management uses this measure and believes it provides users of our financial statements a useful measure reflective of our business’s ability to generate cash earnings to supplement the comparable GAAP measure. Distributable Cash Flow is not intended to represent cash flows from operations or net income (loss) as defined by U.S. GAAP and is not necessarily comparable to similarly titled measures reported by other companies. Non-GAAP measures have limitations as an analytical tool and should not be considered in isolation or in lieu of an analysis of our results as reported under GAAP, and should be evaluated only on a supplementary basis.
INVESTOR RELATIONS CONTACTS Randy Bhatia Vice President, Investor Relations – (713) 375-5479, randy.bhatia@cheniere.com Megan Light Director, Investor Relations – (713) 375-5492, megan.light@cheniere.com