2012 Investor/Analyst Day Conference
Forward Looking Statements 2 This presentation contains certain statements that are, or may be deemed to be, “forward-looking statements within the meaning of Section 27A of the Securities Act of 1933, as amended, and Section 21E of the Securities Exchange Act of 1934, as amended”. All statements, other than statements of historical facts, included herein are “forward-looking statements.” Included among “forward-looking statements” are, among other things: • statements relating to the construction or operation of each of our proposed liquefied natural gas, or LNG, terminals or our proposed pipelines or liquefaction facilities, or expansions or extensions thereof, including statements concerning the commencement, completion or expansion thereof by certain dates or at all, the costs related thereto and certain characteristics, including amounts of regasification, transportation, liquefaction and storage capacity, the number of storage tanks, LNG trains, docks, pipeline deliverability and the number of pipeline interconnections, if any; • statements that we expect to receive an order from the Federal Energy Regulatory Commission, or FERC, authorizing us to construct and operate proposed LNG receiving terminals, liquefaction facilities or proposed pipelines by certain dates, or at all; • statements regarding future levels of domestic natural gas production, supply or consumption; future levels of LNG imports into North America; sales of natural gas in North America or other markets; exports of LNG from North America; and the transportation, other infrastructure or prices related to natural gas, LNG or other energy sources or hydrocarbon products; • statements regarding any financing or refinancing transactions or arrangements, including the amounts or timing thereof, or ability to enter into such transactions or arrangements, whether on the part of Cheniere Energy, Inc., Cheniere Energy Partners, L.P., or any of their subsidiaries or at the project level; • statements regarding any commercial arrangements presently contracted, optioned or marketed, or potential arrangements, to be performed substantially in the future, including any cash distributions and revenues anticipated to be received and the anticipated timing thereof, and statements regarding the amounts of total LNG regasification, liquefaction or storage capacity that are, or may become, subject to such commercial arrangements; • statements regarding the ability of Cheniere Energy Partners, L.P. to pay distributions to its unitholders; • statements regarding the expected receipt of cash distributions from Cheniere Energy Partners, L.P., Sabine Pass LNG, L.P. or Sabine Pass Liquefaction, LLC; • statements regarding counterparties to our commercial contracts, construction contracts and other contracts; • statements relating to the anticipated drop down of the Creole Trail Pipeline from Cheniere Energy, Inc. to Cheniere Energy Partners, L.P.; • statements regarding any business strategy, any business plans or any other plans, forecasts, projections or objectives, including potential revenues and capital expenditures, the payment of dividends and management participation in the funding of projects, any or all of which are subject to change; • statements regarding projections of revenues, expenses, earnings or losses, EBITDA, working capital, cash and debt balances, cash flows, equity ownership or other financial items; • statements regarding legislative, governmental, regulatory, administrative or other public body actions, requirements, permits, investigations, proceedings or decisions; • statements regarding our anticipated LNG and natural gas marketing activities; and • any other statements that relate to non-historical or future information. These forward-looking statements are often identified by the use of terms and phrases such as “achieve,” “anticipate,” “believe,” “contemplate,” “could,” “develop,” “estimate,” “example,” “expect,” “forecast,” “may,” “opportunities,” “plan,” “potential,” “project,” “propose,” “subject to,” and similar terms and phrases. Although we believe that the expectations reflected in these forward-looking statements are reasonable, they do involve assumptions, risks and uncertainties, and these expectations may prove to be incorrect. You should not place undue reliance on these forward-looking statements, which speak only as of the date of this presentation. Our actual results could differ materially from those anticipated in these forward-looking statements as a result of a variety of factors, including those discussed in “Risk Factors” in the Cheniere Energy, Inc. Annual Report on Form 10-K filed with the Securities and Exchange Commission (the “SEC”) on February 24, 2012 and the Cheniere Energy Partners, L.P. Annual Report on Form 10-K filed with the SEC on February 24, 2012 which are incorporated by reference into this presentation. All forward-looking statements attributable to us or persons acting on our behalf are expressly qualified in their entirety by these ”Risk Factors”. These forward-looking statements are made as of the date of this presentation, and we undertake no obligation to publicly update or revise any forward-looking statements.
Introduction Charif Souki, Chairman & CEO Cheniere Energy Investor/Analyst Day Conference September 2012
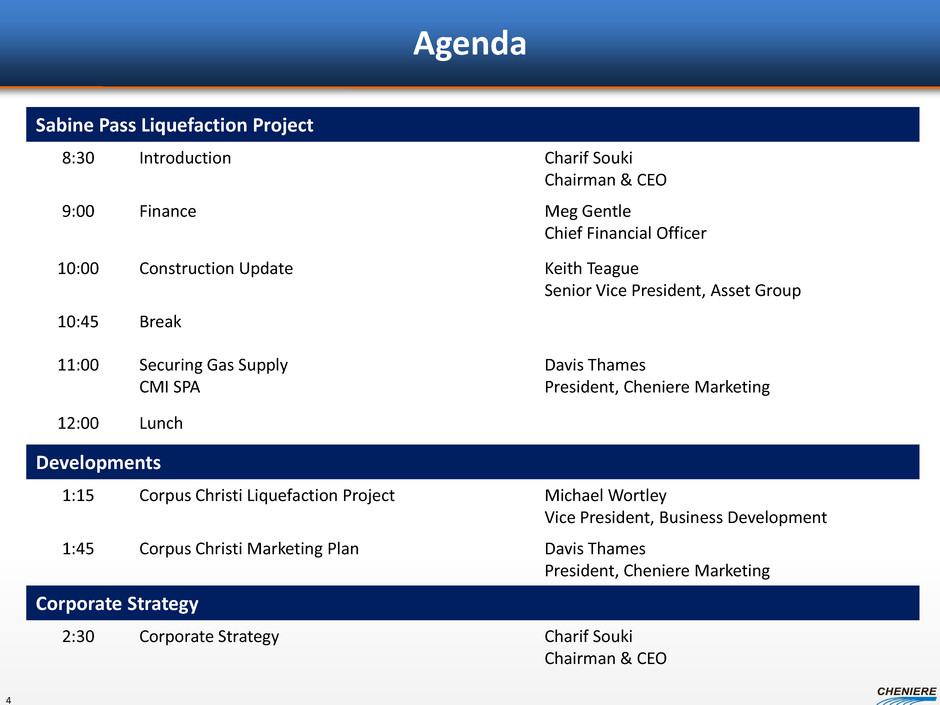
Agenda Sabine Pass Liquefaction Project 8:30 Introduction Charif Souki Chairman & CEO 9:00 Finance Meg Gentle Chief Financial Officer 10:00 Construction Update Keith Teague Senior Vice President, Asset Group 10:45 Break 11:00 Securing Gas Supply CMI SPA Davis Thames President, Cheniere Marketing 12:00 Lunch Developments 1:15 Corpus Christi Liquefaction Project Michael Wortley Vice President, Business Development 1:45 Corpus Christi Marketing Plan Davis Thames President, Cheniere Marketing Corporate Strategy 2:30 Corporate Strategy Charif Souki Chairman & CEO 4
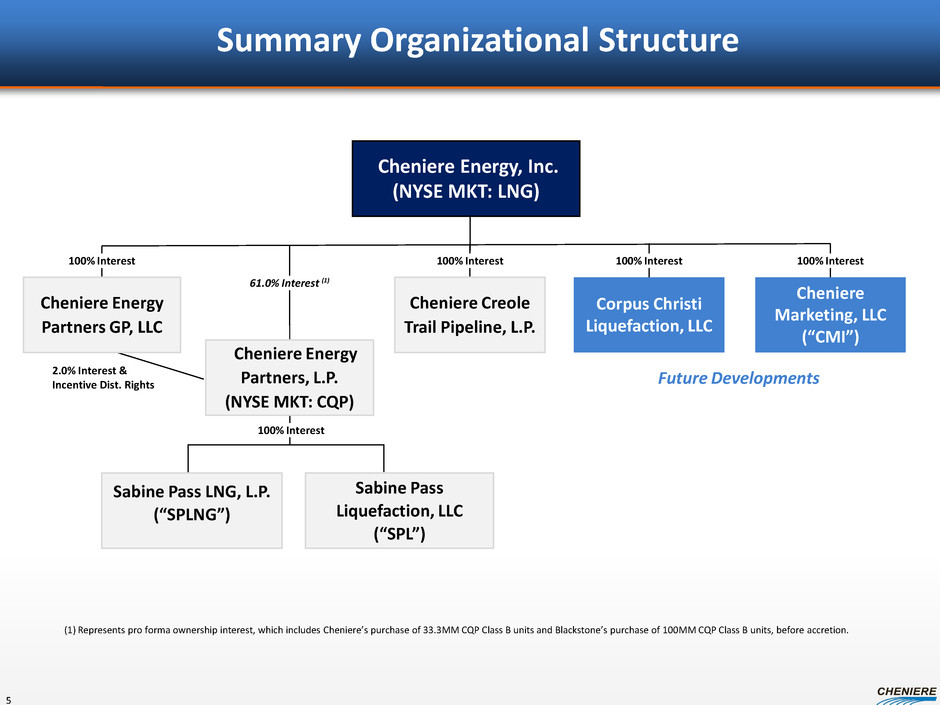
2.0% Interest & Incentive Dist. Rights Cheniere Energy, Inc. (NYSE MKT: LNG) Sabine Pass LNG, L.P. (“SPLNG”) Sabine Pass Liquefaction, LLC (“SPL”) Cheniere Energy Partners, L.P. (NYSE MKT: CQP) Cheniere Creole Trail Pipeline, L.P. Corpus Christi Liquefaction, LLC Cheniere Marketing, LLC (“CMI”) Cheniere Energy Partners GP, LLC 61.0% Interest (1) 100% Interest 100% Interest 100% Interest 100% Interest 100% Interest (1) Represents pro forma ownership interest, which includes Cheniere’s purchase of 33.3MM CQP Class B units and Blackstone’s purchase of 100MM CQP Class B units, before accretion. Future Developments Summary Organizational Structure 5
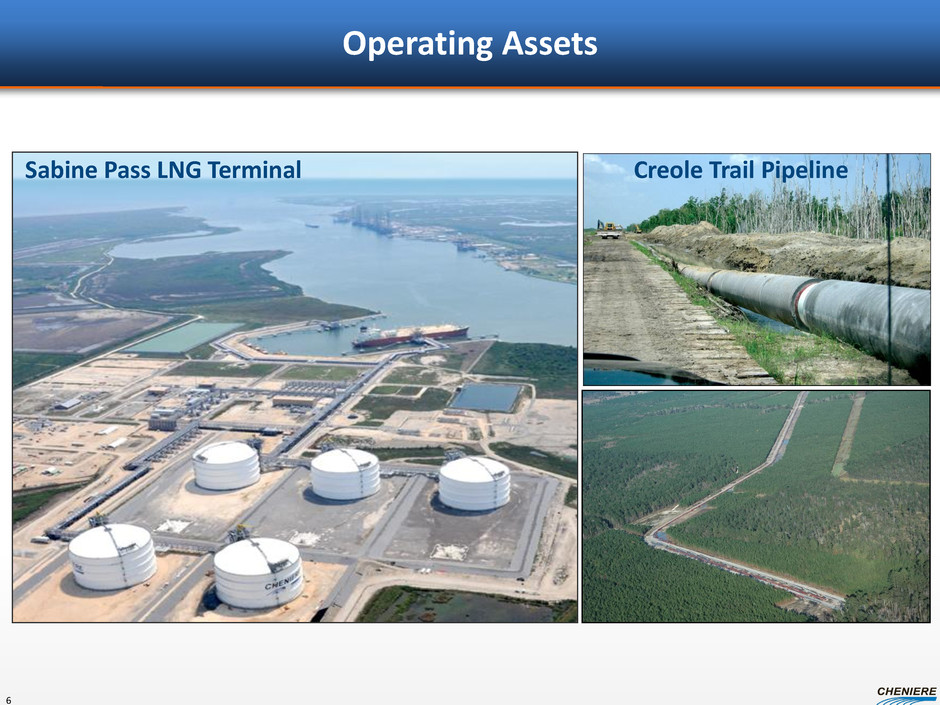
Operating Assets Sabine Pass LNG Terminal Creole Trail Pipeline 6
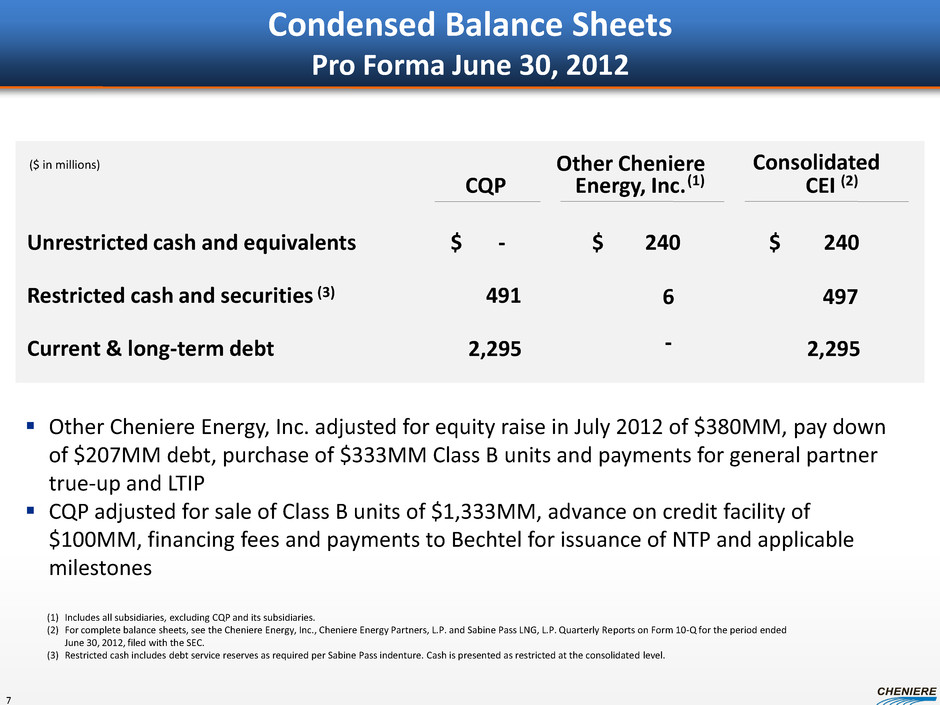
Condensed Balance Sheets Pro Forma June 30, 2012 Other Cheniere Consolidated CQP Energy, Inc. CEI (2) Unrestricted cash and equivalents $ - 240 $ 240 $ Restricted cash and securities 491 Current & long-term debt 2,295 2,295 (1) Includes all subsidiaries, excluding CQP and its subsidiaries. (2) For complete balance sheets, see the Cheniere Energy, Inc., Cheniere Energy Partners, L.P. and Sabine Pass LNG, L.P. Quarterly Reports on Form 10-Q for the period ended June 30, 2012, filed with the SEC. (3) Restricted cash includes debt service reserves as required per Sabine Pass indenture. Cash is presented as restricted at the consolidated level. ($ in millions) (3) 6 - 497 Other Cheniere Energy, Inc. adjusted for equity raise in July 2012 of $380MM, pay down of $207MM debt, purchase of $333MM Class B units and payments for general partner true-up and LTIP CQP adjusted for sale of Class B units of $1,333MM, advance on credit facility of $100MM, financing fees and payments to Bechtel for issuance of NTP and applicable milestones (1) 7
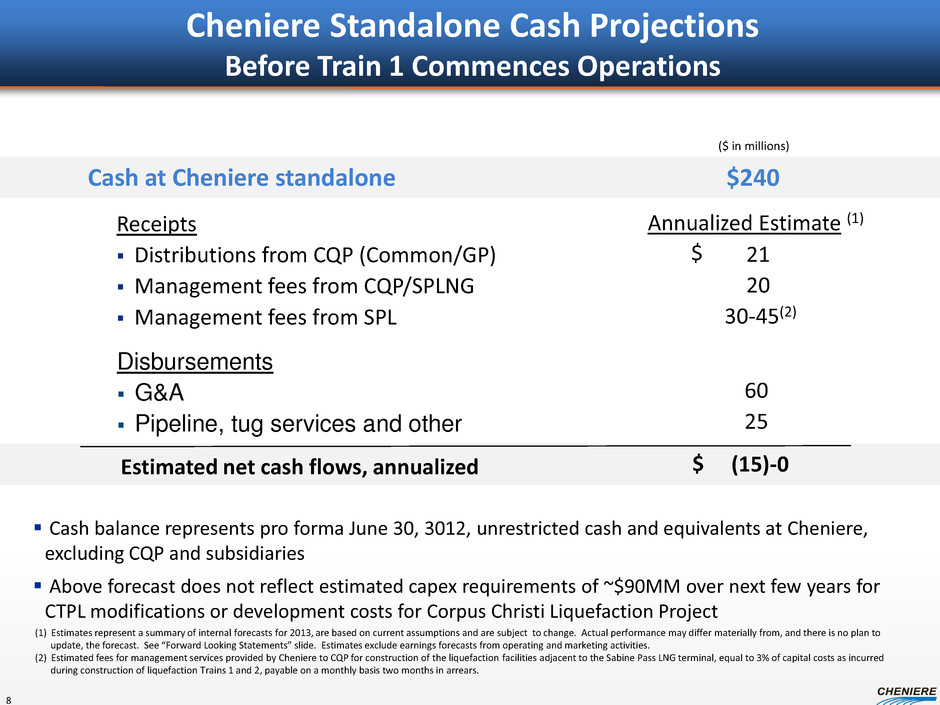
Disbursements G&A Pipeline, tug services and other Cheniere Standalone Cash Projections Before Train 1 Commences Operations Receipts Distributions from CQP (Common/GP) Management fees from CQP/SPLNG Management fees from SPL (15)-0 (1) Estimates represent a summary of internal forecasts for 2013, are based on current assumptions and are subject to change. Actual performance may differ materially from, and there is no plan to update, the forecast. See “Forward Looking Statements” slide. Estimates exclude earnings forecasts from operating and marketing activities. (2) Estimated fees for management services provided by Cheniere to CQP for construction of the liquefaction facilities adjacent to the Sabine Pass LNG terminal, equal to 3% of capital costs as incurred during construction of liquefaction Trains 1 and 2, payable on a monthly basis two months in arrears. Estimated net cash flows, annualized 21 20 30-45(2) 60 25 $ Cash at Cheniere standalone $240 Annualized Estimate (1) Cash balance represents pro forma June 30, 3012, unrestricted cash and equivalents at Cheniere, excluding CQP and subsidiaries Above forecast does not reflect estimated capex requirements of ~$90MM over next few years for CTPL modifications or development costs for Corpus Christi Liquefaction Project $ ($ in millions) 8
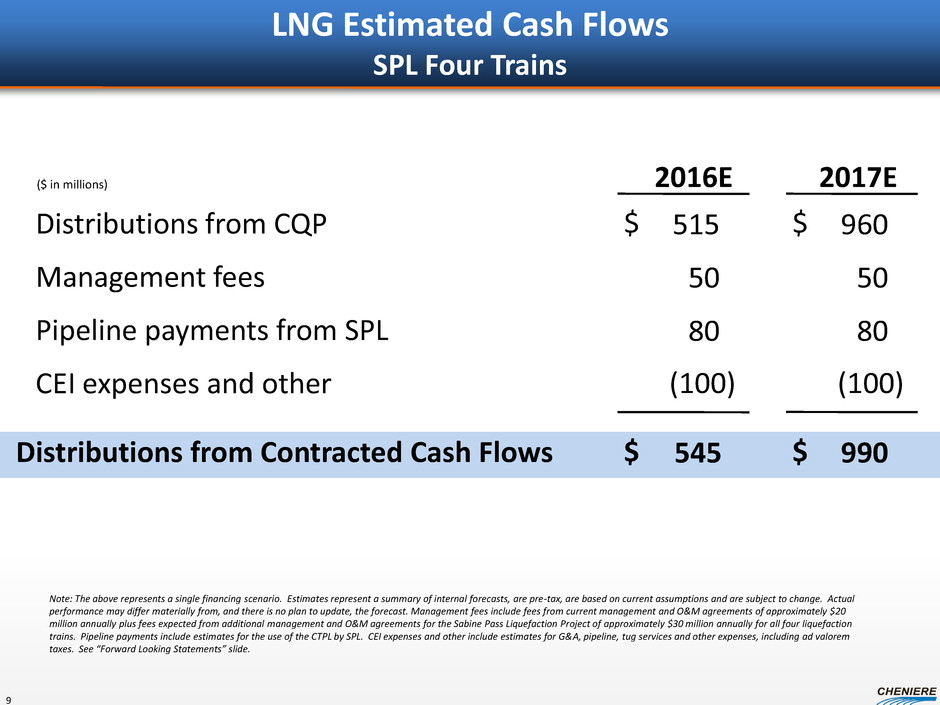
LNG Estimated Cash Flows SPL Four Trains 2017E Distributions from CQP Management fees Pipeline payments from SPL CEI expenses and other Distributions from Contracted Cash Flows 2016E $ 545 515 50 80 $ ($ in millions) $ 990 960 50 80 $ (100) (100) Note: The above represents a single financing scenario. Estimates represent a summary of internal forecasts, are pre-tax, are based on current assumptions and are subject to change. Actual performance may differ materially from, and there is no plan to update, the forecast. Management fees include fees from current management and O&M agreements of approximately $20 million annually plus fees expected from additional management and O&M agreements for the Sabine Pass Liquefaction Project of approximately $30 million annually for all four liquefaction trains. Pipeline payments include estimates for the use of the CTPL by SPL. CEI expenses and other include estimates for G&A, pipeline, tug services and other expenses, including ad valorem taxes. See “Forward Looking Statements” slide. 9
Finance Meg Gentle, Chief Financial Officer Cheniere Energy Investor/Analyst Day Conference September 2012
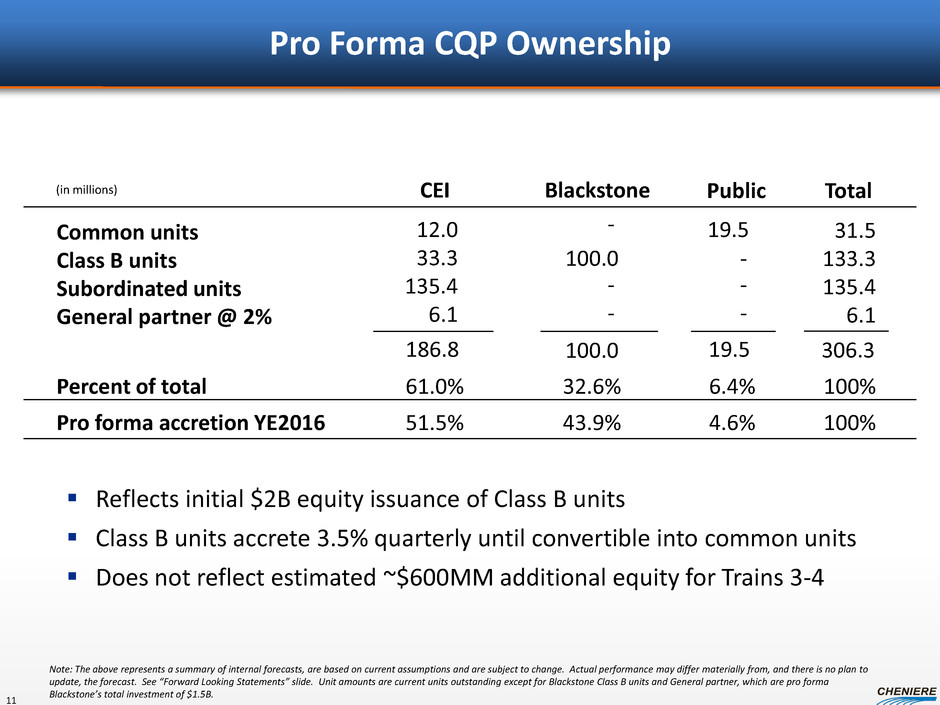
Pro Forma CQP Ownership Common units Class B units Subordinated units General partner @ 2% 19.5 12.0 33.3 135.4 6.1 Public CEI 19.5 186.8 (in millions) 31.5 133.3 135.4 6.1 306.3 Total 61.0% 6.4% 100% Percent of total - - - Blackstone 32.6% 100.0 - - - 100.0 Reflects initial $2B equity issuance of Class B units Class B units accrete 3.5% quarterly until convertible into common units Does not reflect estimated ~$600MM additional equity for Trains 3-4 51.5% 4.6% 100% Pro forma accretion YE2016 43.9% Note: The above represents a summary of internal forecasts, are based on current assumptions and are subject to change. Actual performance may differ materially from, and there is no plan to update, the forecast. See “Forward Looking Statements” slide. Unit amounts are current units outstanding except for Blackstone Class B units and General partner, which are pro forma Blackstone’s total investment of $1.5B. 11
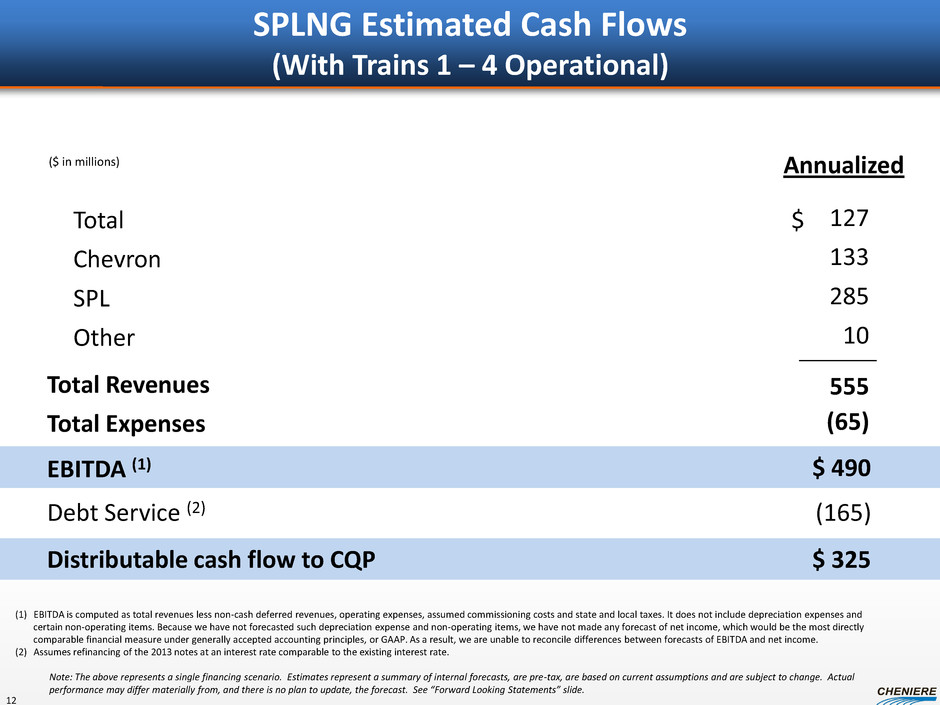
SPLNG Estimated Cash Flows (With Trains 1 – 4 Operational) Total Revenues Total Expenses Total Chevron SPL Other EBITDA (1) 127 133 285 10 555 (65) $ 490 $ Distributable cash flow to CQP $ 325 ($ in millions) Debt Service (2) (165) Annualized (1) EBITDA is computed as total revenues less non-cash deferred revenues, operating expenses, assumed commissioning costs and state and local taxes. It does not include depreciation expenses and certain non-operating items. Because we have not forecasted such depreciation expense and non-operating items, we have not made any forecast of net income, which would be the most directly comparable financial measure under generally accepted accounting principles, or GAAP. As a result, we are unable to reconcile differences between forecasts of EBITDA and net income. (2) Assumes refinancing of the 2013 notes at an interest rate comparable to the existing interest rate. Note: The above represents a single financing scenario. Estimates represent a summary of internal forecasts, are pre-tax, are based on current assumptions and are subject to change. Actual performance may differ materially from, and there is no plan to update, the forecast. See “Forward Looking Statements” slide. 12
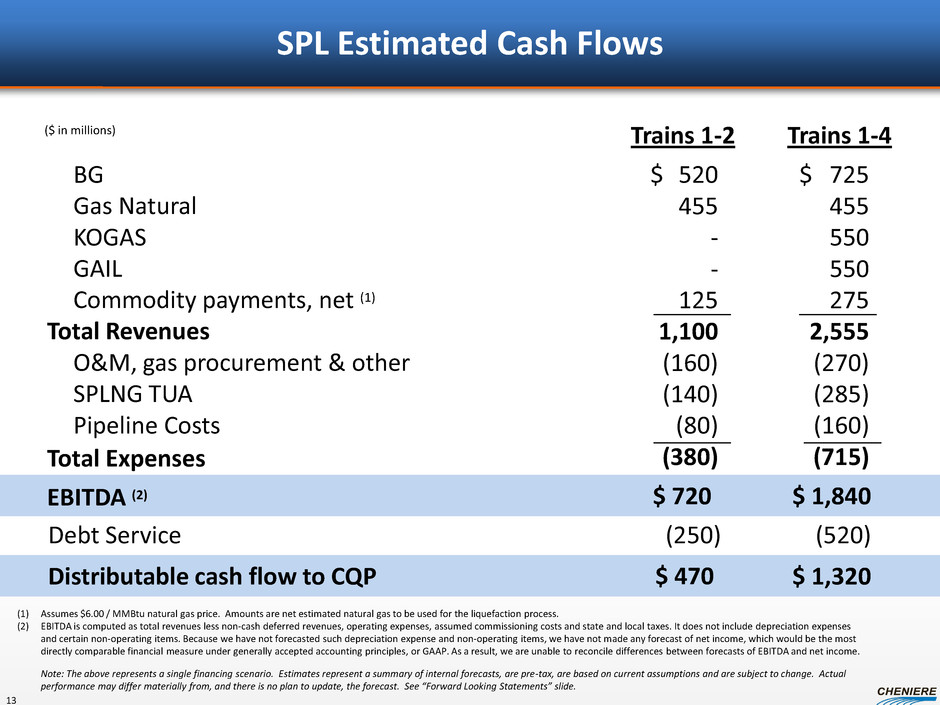
SPL Estimated Cash Flows Trains 1-4 Total Revenues Trains 1-2 BG Gas Natural KOGAS GAIL Commodity payments, net (1) O&M, gas procurement & other SPLNG TUA Pipeline Costs 520 455 - - 125 1,100 (160) (140) (80) (380) EBITDA (2) 725 455 550 550 275 2,555 (270) (285) (160) (715) $ 1,840 $ 720 $ $ Distributable cash flow to CQP $ 1,320 ($ in millions) $ 470 Debt Service (520) (250) Total Expenses (1) Assumes $6.00 / MMBtu natural gas price. Amounts are net estimated natural gas to be used for the liquefaction process. (2) EBITDA is computed as total revenues less non-cash deferred revenues, operating expenses, assumed commissioning costs and state and local taxes. It does not include depreciation expenses and certain non-operating items. Because we have not forecasted such depreciation expense and non-operating items, we have not made any forecast of net income, which would be the most directly comparable financial measure under generally accepted accounting principles, or GAAP. As a result, we are unable to reconcile differences between forecasts of EBITDA and net income. Note: The above represents a single financing scenario. Estimates represent a summary of internal forecasts, are pre-tax, are based on current assumptions and are subject to change. Actual performance may differ materially from, and there is no plan to update, the forecast. See “Forward Looking Statements” slide. 13
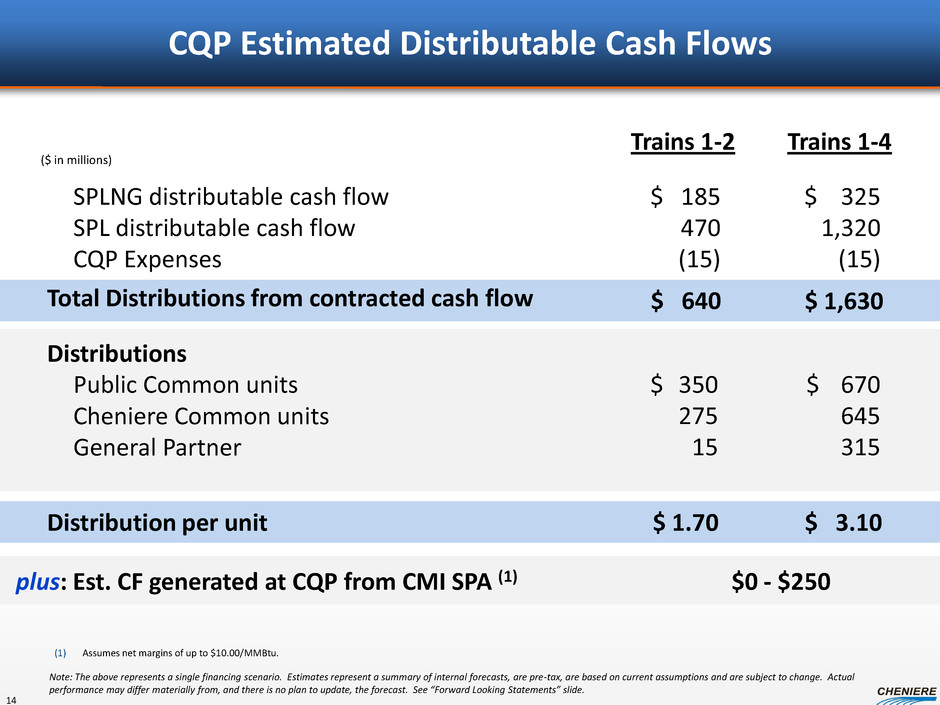
CQP Estimated Distributable Cash Flows Trains 1-4 Distributions Trains 1-2 Public Common units Cheniere Common units General Partner 350 275 15 Distribution per unit 670 645 315 $ 3.10 $ 1.70 $ $ Total Distributions from contracted cash flow $ 1,630 ($ in millions) $ 640 SPLNG distributable cash flow SPL distributable cash flow CQP Expenses $ 185 470 (15) $ 325 1,320 (15) plus: Est. CF generated at CQP from CMI SPA (1) $0 - $250 (1) Assumes net margins of up to $10.00/MMBtu. Note: The above represents a single financing scenario. Estimates represent a summary of internal forecasts, are pre-tax, are based on current assumptions and are subject to change. Actual performance may differ materially from, and there is no plan to update, the forecast. See “Forward Looking Statements” slide. 14
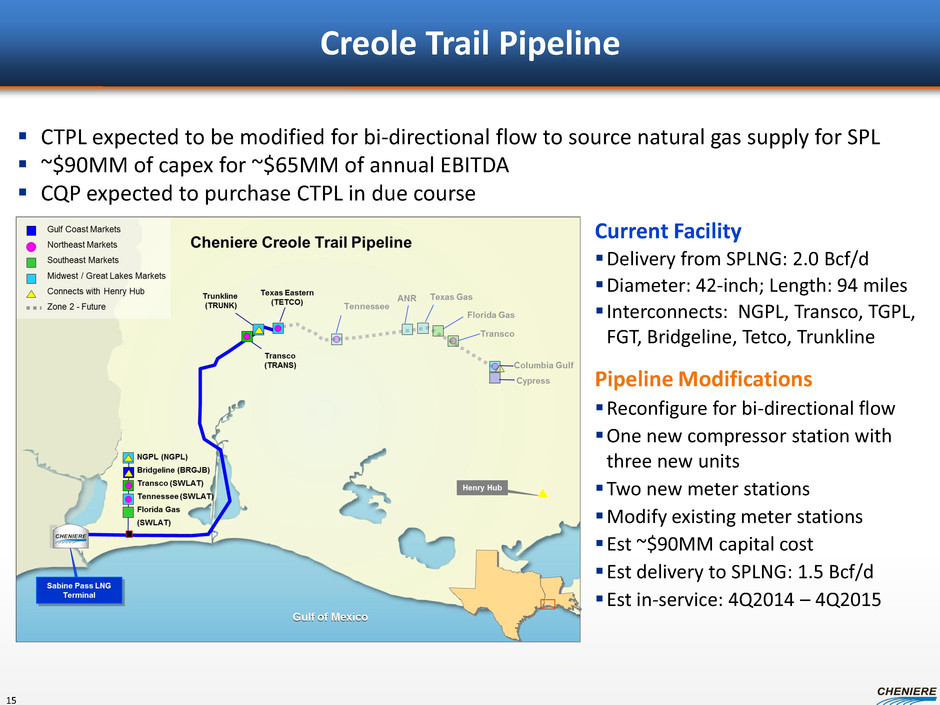
Current Facility Delivery from SPLNG: 2.0 Bcf/d Diameter: 42-inch; Length: 94 miles Interconnects: NGPL, Transco, TGPL, FGT, Bridgeline, Tetco, Trunkline Pipeline Modifications Reconfigure for bi-directional flow One new compressor station with three new units Two new meter stations Modify existing meter stations Est ~$90MM capital cost Est delivery to SPLNG: 1.5 Bcf/d Est in-service: 4Q2014 – 4Q2015 Creole Trail Pipeline CTPL expected to be modified for bi-directional flow to source natural gas supply for SPL ~$90MM of capex for ~$65MM of annual EBITDA CQP expected to purchase CTPL in due course 15
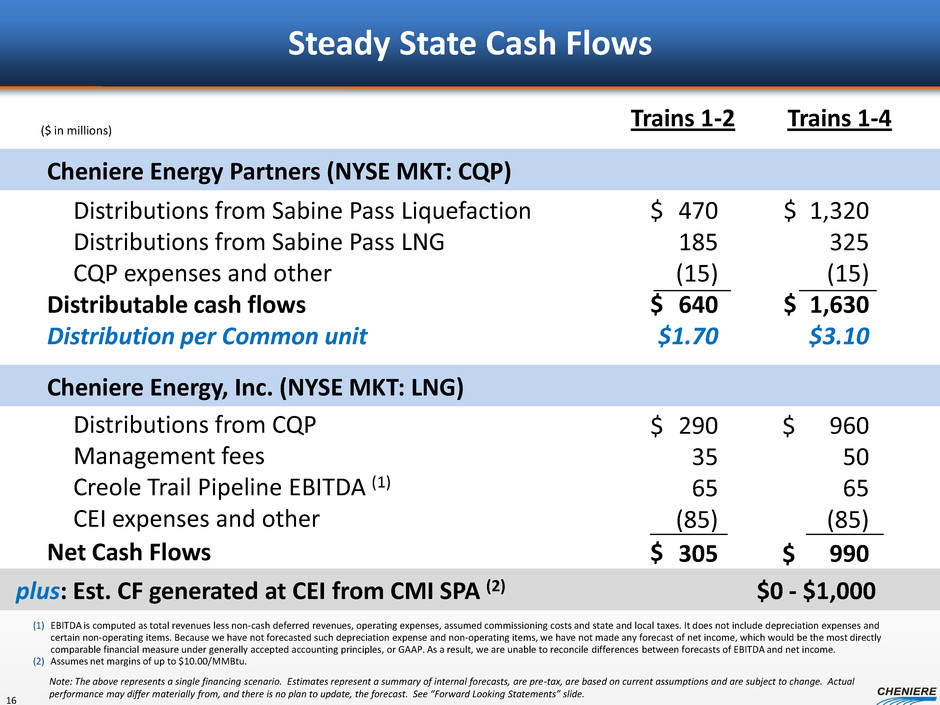
Steady State Cash Flows Trains 1-4 Distributable cash flows Distribution per Common unit Trains 1-2 Distributions from Sabine Pass Liquefaction Distributions from Sabine Pass LNG CQP expenses and other 470 185 (15) 640 $1.70 Cheniere Energy Partners (NYSE MKT: CQP) 1,320 325 (15) 1,630 $3.10 $ $ ($ in millions) Net Cash Flows Cheniere Energy, Inc. (NYSE MKT: LNG) Distributions from CQP Management fees Creole Trail Pipeline EBITDA (1) CEI expenses and other 290 35 65 (85) 305 960 50 65 (85) 990 $ $ $ $ $ $ plus: Est. CF generated at CEI from CMI SPA (2) $0 - $1,000 (1) EBITDA is computed as total revenues less non-cash deferred revenues, operating expenses, assumed commissioning costs and state and local taxes. It does not include depreciation expenses and certain non-operating items. Because we have not forecasted such depreciation expense and non-operating items, we have not made any forecast of net income, which would be the most directly comparable financial measure under generally accepted accounting principles, or GAAP. As a result, we are unable to reconcile differences between forecasts of EBITDA and net income. (2) Assumes net margins of up to $10.00/MMBtu. Note: The above represents a single financing scenario. Estimates represent a summary of internal forecasts, are pre-tax, are based on current assumptions and are subject to change. Actual performance may differ materially from, and there is no plan to update, the forecast. See “Forward Looking Statements” slide. 16
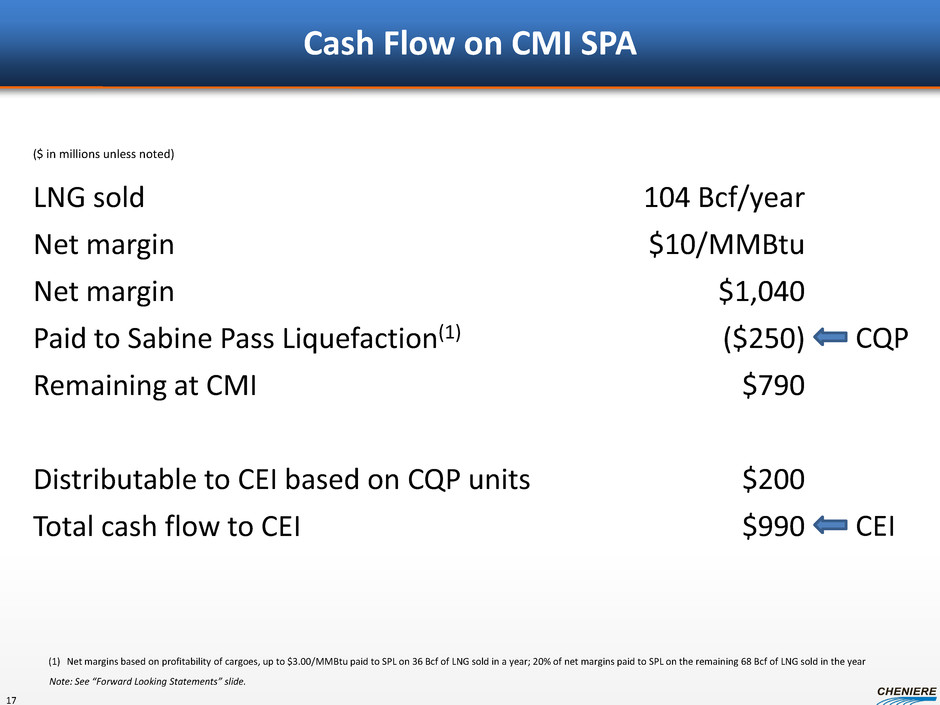
Cash Flow on CMI SPA (1) Net margins based on profitability of cargoes, up to $3.00/MMBtu paid to SPL on 36 Bcf of LNG sold in a year; 20% of net margins paid to SPL on the remaining 68 Bcf of LNG sold in the year LNG sold 104 Bcf/year Net margin $10/MMBtu Net margin $1,040 Paid to Sabine Pass Liquefaction(1) ($250) Remaining at CMI $790 Distributable to CEI based on CQP units $200 Total cash flow to CEI $990 ($ in millions unless noted) CQP CEI Note: See “Forward Looking Statements” slide. 17
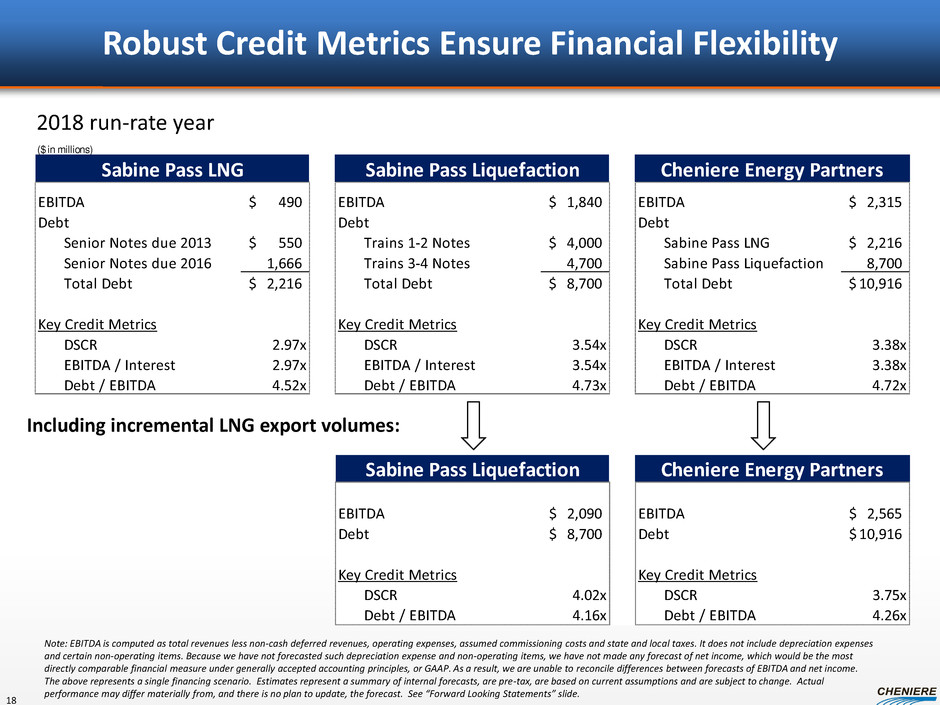
Robust Credit Metrics Ensure Financial Flexibility Including incremental LNG export volumes: ($ in millions) EBITDA 490$ EBITDA 1,840$ EBITDA 2,315$ Debt Debt Debt Senior Notes due 2013 550$ Trains 1-2 Notes 4,000$ Sabine Pass LNG 2,216$ S nior Notes due 2016 1,666 Trains 3-4 Notes 4,700 Sabine Pass Liquefaction 8,700 Total Debt 2,216$ Total Debt 8,700$ Total Debt 10,916$ Key Credit Metrics Key Credit Metrics Key Credit Metrics DSCR 2.97x DSCR 3.54x DSCR 3.38x EBITDA / Interest 2.97x EBITDA / Interest 3.54x EBITDA / Interest 3.38x Debt / EBITDA 4.52x Debt / EBITDA 4.73x Debt / EBITDA 4.72x Sabine Pass LNG Sabine Pass Liquefaction Cheniere Energy Partners 2018 run-rate year EBITDA 2,090$ EBITDA 2,565$ Debt 8,700$ Debt 10,916$ Key Credit Metrics Key Credit Metrics DSCR 4.02x DSCR 3.75x Debt / EBITDA 4.16x Debt / EBITDA 4.26x Sabine Pass Liquefaction Cheniere Energy Partners Note: EBITDA is computed as total revenues less non-cash deferred revenues, operating expenses, assumed commissioning costs and state and local taxes. It does not include depreciation expenses and certain non-operating items. Because we have not forecasted such depreciation expense and non-operating items, we have not made any forecast of net income, which would be the most directly comparable financial measure under generally accepted accounting principles, or GAAP. As a result, we are unable to reconcile differences between forecasts of EBITDA and net income. The above represents a single financing scenario. Estimates represent a summary of internal forecasts, are pre-tax, are based on current assumptions and are subject to change. Actual performance may differ materially from, and there is no plan to update, the forecast. See “Forward Looking Statements” slide. 18
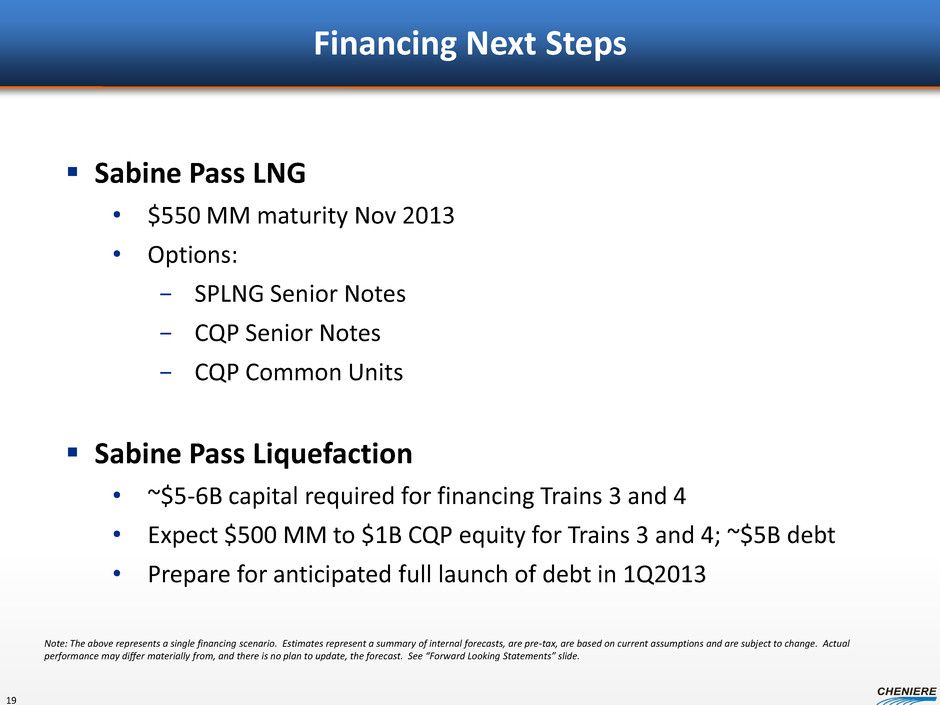
Financing Next Steps Sabine Pass LNG • $550 MM maturity Nov 2013 • Options: − SPLNG Senior Notes − CQP Senior Notes − CQP Common Units Sabine Pass Liquefaction • ~$5-6B capital required for financing Trains 3 and 4 • Expect $500 MM to $1B CQP equity for Trains 3 and 4; ~$5B debt • Prepare for anticipated full launch of debt in 1Q2013 19 Note: The above represents a single financing scenario. Estimates represent a summary of internal forecasts, are pre-tax, are based on current assumptions and are subject to change. Actual performance may differ materially from, and there is no plan to update, the forecast. See “Forward Looking Statements” slide.
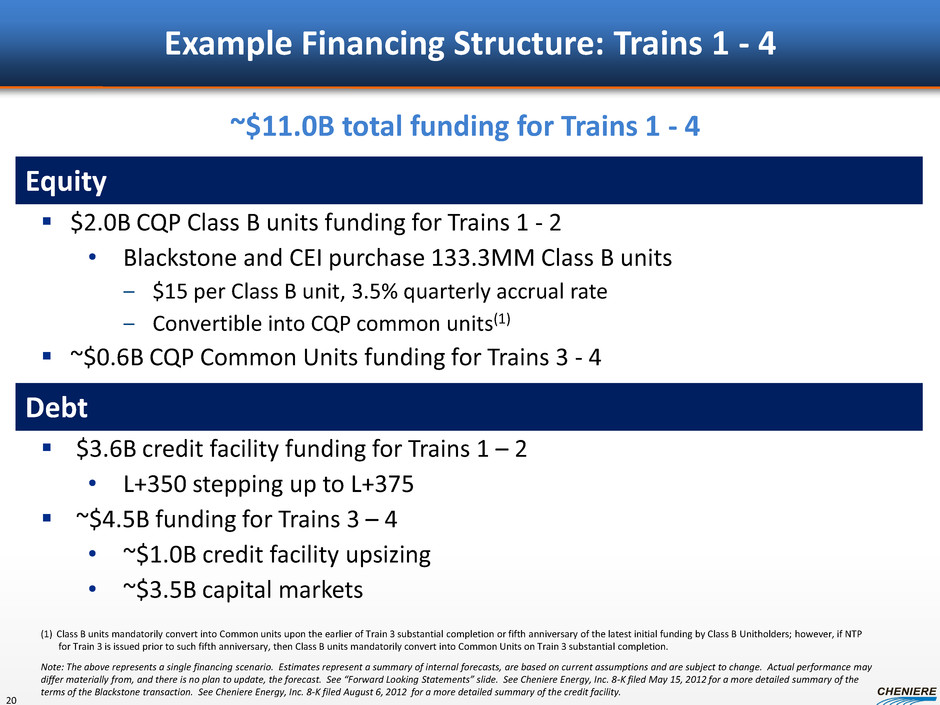
Example Financing Structure: Trains 1 - 4 ~$11.0B total funding for Trains 1 - 4 Equity $2.0B CQP Class B units funding for Trains 1 - 2 • Blackstone and CEI purchase 133.3MM Class B units ‒ $15 per Class B unit, 3.5% quarterly accrual rate ‒ Convertible into CQP common units(1) ~$0.6B CQP Common Units funding for Trains 3 - 4 Debt $3.6B credit facility funding for Trains 1 – 2 • L+350 stepping up to L+375 ~$4.5B funding for Trains 3 – 4 • ~$1.0B credit facility upsizing • ~$3.5B capital markets (1) Class B units mandatorily convert into Common units upon the earlier of Train 3 substantial completion or fifth anniversary of the latest initial funding by Class B Unitholders; however, if NTP for Train 3 is issued prior to such fifth anniversary, then Class B units mandatorily convert into Common Units on Train 3 substantial completion. Note: The above represents a single financing scenario. Estimates represent a summary of internal forecasts, are based on current assumptions and are subject to change. Actual performance may differ materially from, and there is no plan to update, the forecast. See “Forward Looking Statements” slide. See Cheniere Energy, Inc. 8-K filed May 15, 2012 for a more detailed summary of the terms of the Blackstone transaction. See Cheniere Energy, Inc. 8-K filed August 6, 2012 for a more detailed summary of the credit facility. 20
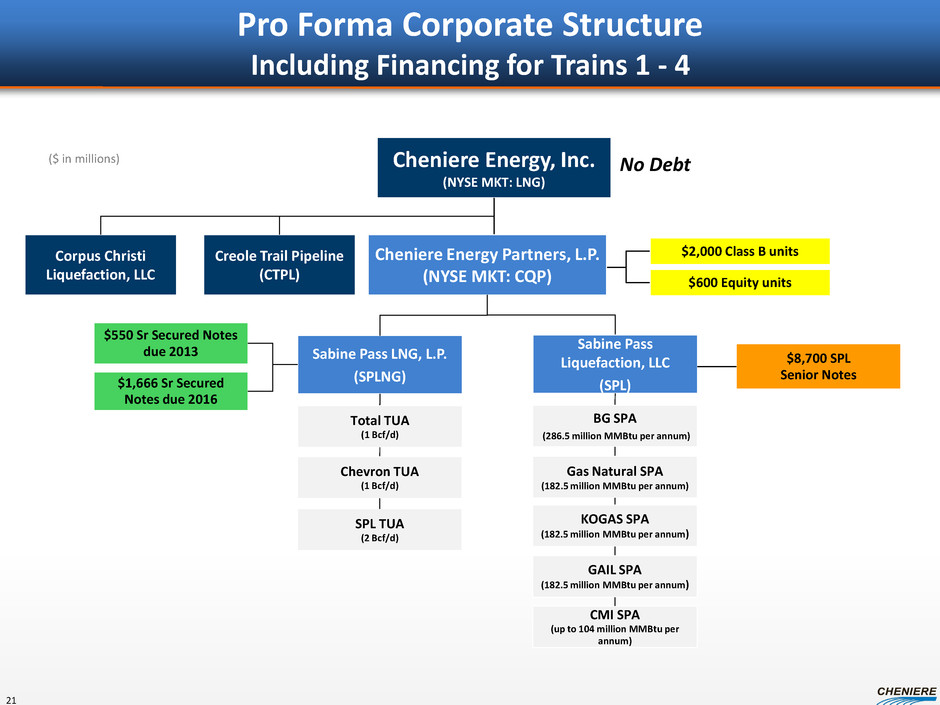
Pro Forma Corporate Structure Including Financing for Trains 1 - 4 Cheniere Energy, Inc. (NYSE MKT: LNG) Cheniere Energy Partners, L.P. (NYSE MKT: CQP) Sabine Pass Liquefaction, LLC (SPL) Sabine Pass LNG, L.P. (SPLNG) $2,000 Class B units BG SPA (286.5 million MMBtu per annum) $600 Equity units $8,700 SPL Senior Notes Gas Natural SPA (182.5 million MMBtu per annum) KOGAS SPA (182.5 million MMBtu per annum) GAIL SPA (182.5 million MMBtu per annum) Total TUA (1 Bcf/d) Chevron TUA (1 Bcf/d) SPL TUA (2 Bcf/d) $550 Sr Secured Notes due 2013 $1,666 Sr Secured Notes due 2016 ($ in millions) CMI SPA (up to 104 million MMBtu per annum) No Debt Creole Trail Pipeline (CTPL) Corpus Christi Liquefaction, LLC 21
Construction Update Keith Teague, Senior Vice President, Asset Group Cheniere Energy Investor/Analyst Day Conference September 2012
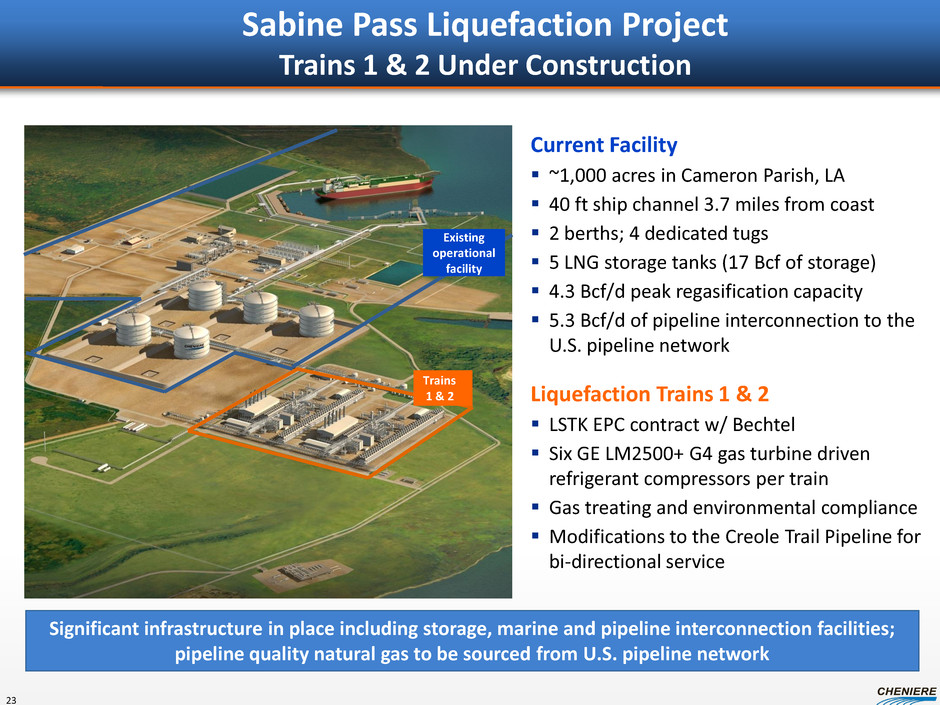
Sabine Pass Liquefaction Project Trains 1 & 2 Under Construction Current Facility ~1,000 acres in Cameron Parish, LA 40 ft ship channel 3.7 miles from coast 2 berths; 4 dedicated tugs 5 LNG storage tanks (17 Bcf of storage) 4.3 Bcf/d peak regasification capacity 5.3 Bcf/d of pipeline interconnection to the U.S. pipeline network Liquefaction Trains 1 & 2 LSTK EPC contract w/ Bechtel Six GE LM2500+ G4 gas turbine driven refrigerant compressors per train Gas treating and environmental compliance Modifications to the Creole Trail Pipeline for bi-directional service Significant infrastructure in place including storage, marine and pipeline interconnection facilities; pipeline quality natural gas to be sourced from U.S. pipeline network Existing operational facility Trains 1 & 2 23
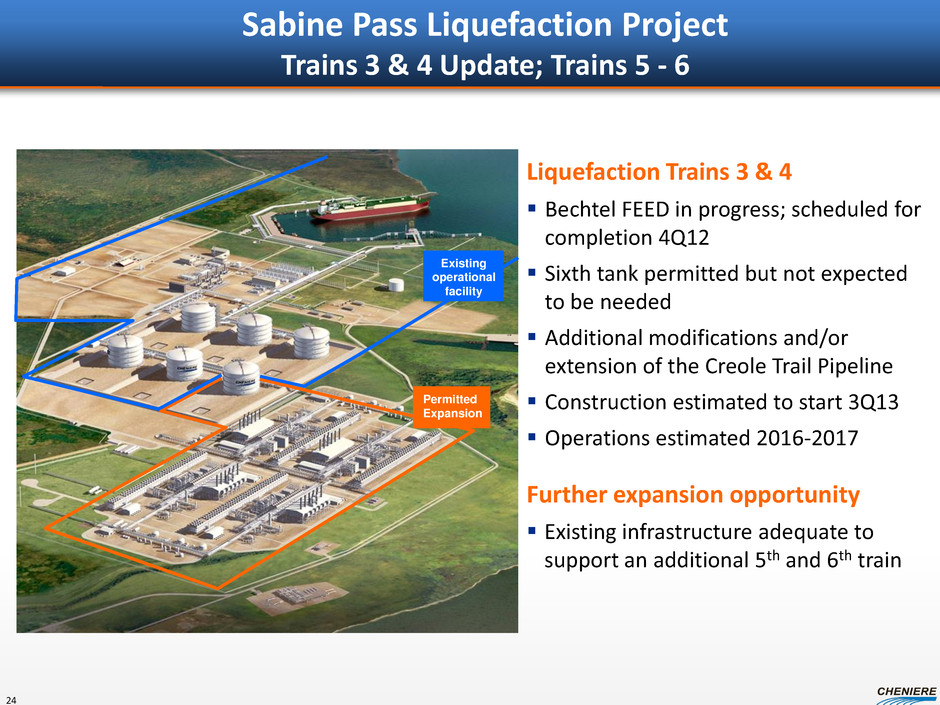
Sabine Pass Liquefaction Project Trains 3 & 4 Update; Trains 5 - 6 Liquefaction Trains 3 & 4 Bechtel FEED in progress; scheduled for completion 4Q12 Sixth tank permitted but not expected to be needed Additional modifications and/or extension of the Creole Trail Pipeline Construction estimated to start 3Q13 Operations estimated 2016-2017 Further expansion opportunity Existing infrastructure adequate to support an additional 5th and 6th train Existing operational facility Permitted Expansion 24
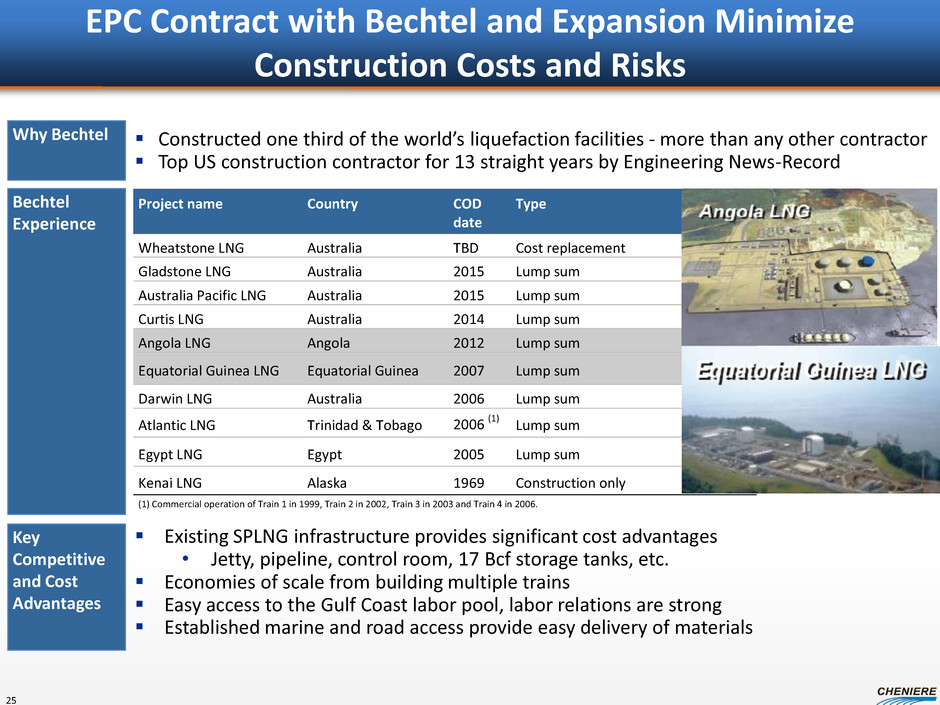
Why Bechtel Constructed one third of the world’s liquefaction facilities - more than any other contractor Top US construction contractor for 13 straight years by Engineering News-Record Bechtel Experience Key Competitive and Cost Advantages Existing SPLNG infrastructure provides significant cost advantages • Jetty, pipeline, control room, 17 Bcf storage tanks, etc. Economies of scale from building multiple trains Easy access to the Gulf Coast labor pool, labor relations are strong Established marine and road access provide easy delivery of materials Project name Country COD date Type Wheatstone LNG Australia TBD Cost replacement Gladstone LNG Australia 2015 Lump sum Australia Pacific LNG Australia 2015 Lump sum Curtis LNG Australia 2014 Lump sum Angola LNG Angola 2012 Lump sum Equatorial Guinea LNG Equatorial Guinea 2007 Lump sum Darwin LNG Australia 2006 Lump sum Atlantic LNG Trinidad & Tobago 2006 (1) Lump sum Egypt LNG Egypt 2005 Lump sum Kenai LNG Alaska 1969 Construction only (1) Commercial operation of Train 1 in 1999, Train 2 in 2002, Train 3 in 2003 and Train 4 in 2006. EPC Contract with Bechtel and Expansion Minimize Construction Costs and Risks 25
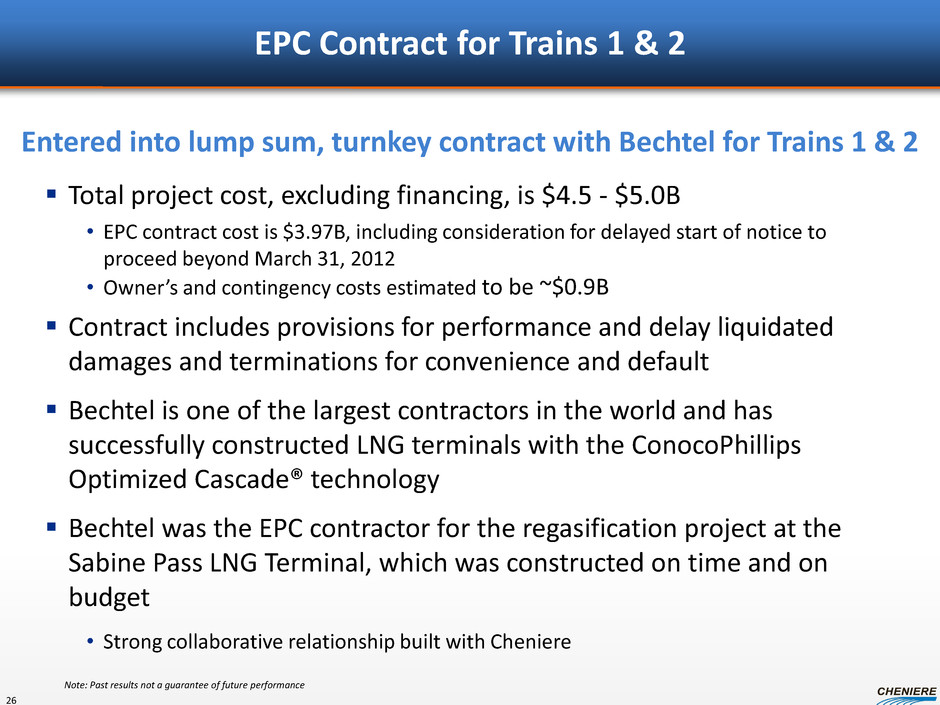
EPC Contract for Trains 1 & 2 Total project cost, excluding financing, is $4.5 - $5.0B • EPC contract cost is $3.97B, including consideration for delayed start of notice to proceed beyond March 31, 2012 • Owner’s and contingency costs estimated to be ~$0.9B Contract includes provisions for performance and delay liquidated damages and terminations for convenience and default Bechtel is one of the largest contractors in the world and has successfully constructed LNG terminals with the ConocoPhillips Optimized Cascade® technology Bechtel was the EPC contractor for the regasification project at the Sabine Pass LNG Terminal, which was constructed on time and on budget • Strong collaborative relationship built with Cheniere Entered into lump sum, turnkey contract with Bechtel for Trains 1 & 2 26 Note: Past results not a guarantee of future performance
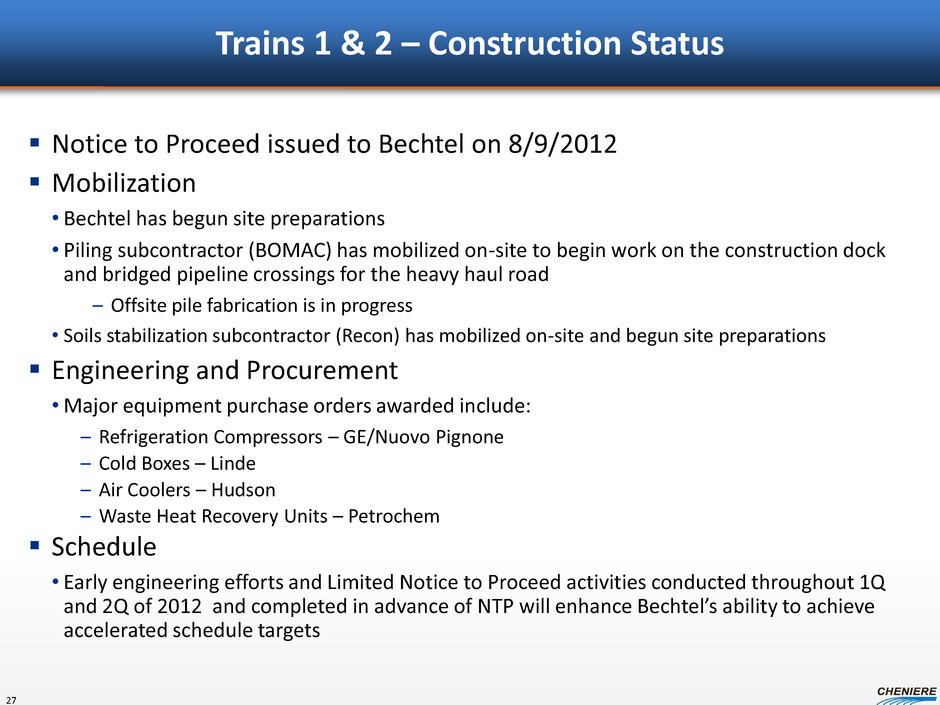
Trains 1 & 2 – Construction Status Notice to Proceed issued to Bechtel on 8/9/2012 Mobilization • Bechtel has begun site preparations • Piling subcontractor (BOMAC) has mobilized on-site to begin work on the construction dock and bridged pipeline crossings for the heavy haul road – Offsite pile fabrication is in progress • Soils stabilization subcontractor (Recon) has mobilized on-site and begun site preparations Engineering and Procurement •Major equipment purchase orders awarded include: – Refrigeration Compressors – GE/Nuovo Pignone – Cold Boxes – Linde – Air Coolers – Hudson – Waste Heat Recovery Units – Petrochem Schedule • Early engineering efforts and Limited Notice to Proceed activities conducted throughout 1Q and 2Q of 2012 and completed in advance of NTP will enhance Bechtel’s ability to achieve accelerated schedule targets 27
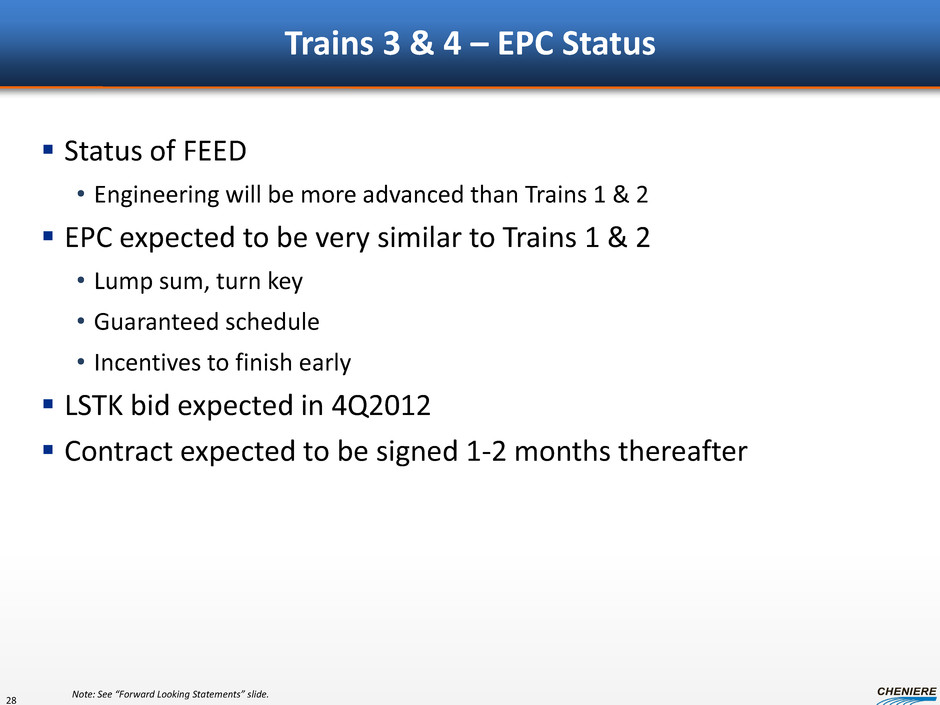
Trains 3 & 4 – EPC Status Status of FEED • Engineering will be more advanced than Trains 1 & 2 EPC expected to be very similar to Trains 1 & 2 • Lump sum, turn key • Guaranteed schedule • Incentives to finish early LSTK bid expected in 4Q2012 Contract expected to be signed 1-2 months thereafter Note: See “Forward Looking Statements” slide. 28
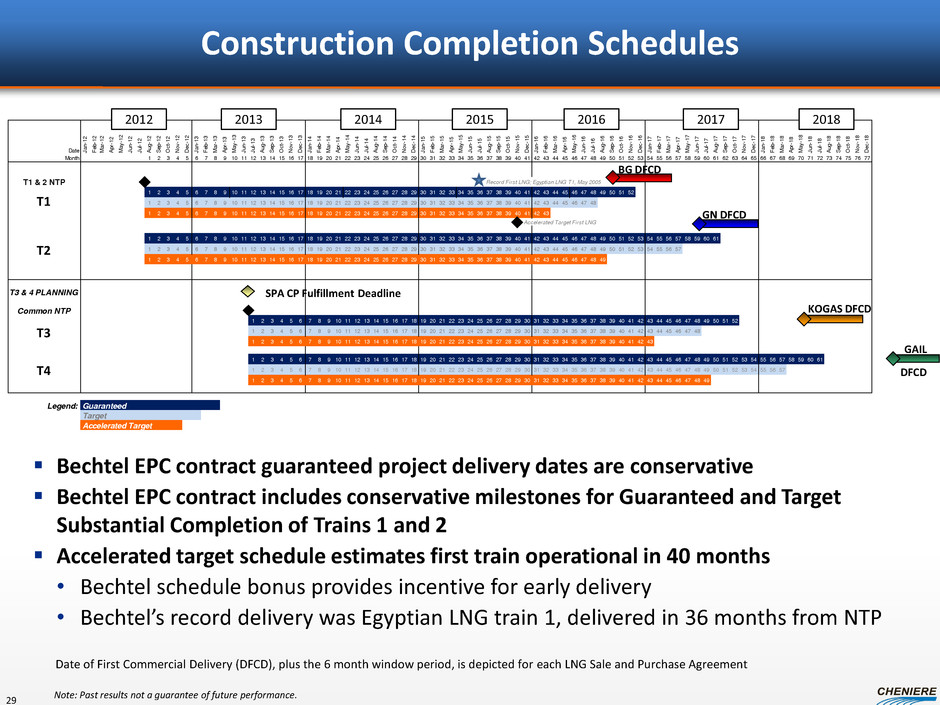
Date Jan -12 Feb -12 Mar -12 Apr -12 May -12 Jun -12 Jul- 12 Aug -12 Sep -12 Oct -12 Nov -12 Dec -12 Jan -13 Feb -13 Mar -13 Apr -13 May -13 Jun -13 Jul- 13 Aug -13 Sep -13 Oct -13 Nov -13 Dec -13 Jan -14 Feb -14 Mar -14 Apr -14 May -14 Jun -14 Jul- 14 Aug -14 Sep -14 Oct -14 Nov -14 Dec -14 Jan -15 Feb -15 Mar -15 Apr -15 May -15 Jun -15 Jul- 15 Aug -15 Sep -15 Oct -15 Nov -15 Dec -15 Jan -16 Feb -16 Mar -16 Apr -16 May -16 Jun -16 Jul- 16 Aug -16 Sep -16 Oct -16 Nov -16 Dec -16 Jan -17 Feb -17 Mar -17 Apr -17 May -17 Jun -17 Jul- 17 Aug -17 Sep -17 Oct -17 Nov -17 Dec -17 Jan -18 Feb -18 Mar -18 Apr -18 May -18 Jun -18 Jul- 18 Aug -18 Sep -18 Oct -18 Nov -18 Dec -18 Month 1 2 3 4 5 6 7 8 9 10 11 12 13 14 15 16 17 18 19 20 21 22 23 24 25 26 27 28 29 30 31 32 33 34 35 36 37 38 39 40 41 42 43 44 45 46 47 48 49 50 51 52 53 54 55 56 57 58 59 60 61 62 63 64 65 66 67 68 69 70 71 72 73 74 75 76 77 T1 & 2 NTP Record First LNG; Egyptian LNG T1, May 2005 1 2 3 4 5 6 7 8 9 10 11 12 13 14 15 16 17 18 19 20 21 22 23 24 25 26 27 28 29 30 31 32 33 34 35 36 37 38 39 40 41 42 43 44 45 46 47 48 49 50 51 52 1 2 3 4 5 6 7 8 9 10 11 12 13 14 15 16 17 18 19 20 21 22 23 24 25 26 27 28 29 30 31 32 33 34 35 36 37 38 39 40 41 42 43 44 45 46 47 48 1 2 3 4 5 6 7 8 9 10 11 12 13 14 15 16 17 18 19 20 21 22 23 24 25 26 27 28 29 30 31 32 33 34 35 36 37 38 39 40 41 42 43 Accelerated Target First LNG 1 2 3 4 5 6 7 8 9 10 11 12 13 14 15 16 17 18 19 20 21 22 23 24 25 26 27 28 29 30 31 32 33 34 35 36 37 38 39 40 41 42 43 44 45 46 47 48 49 50 51 52 53 54 55 56 57 58 59 60 61 1 2 3 4 5 6 7 8 9 10 11 12 13 14 15 16 17 18 19 20 21 22 23 24 25 26 27 28 29 30 31 32 33 34 35 36 37 38 39 40 41 42 43 44 45 46 47 48 49 50 51 52 53 54 55 56 57 1 2 3 4 5 6 7 8 9 10 11 12 13 14 15 16 17 18 19 20 21 22 23 24 25 26 27 28 29 30 31 32 33 34 35 36 37 38 39 40 41 42 43 44 45 46 47 48 49 T3 & 4 PLANNING Common NTP 1 2 3 4 5 6 7 8 9 10 11 12 13 14 15 16 17 18 19 20 21 22 23 24 25 26 27 28 29 30 31 32 33 34 35 36 37 38 39 40 41 42 43 44 45 46 47 48 49 50 51 52 1 2 3 4 5 6 7 8 9 10 11 12 13 14 15 16 17 18 19 20 21 22 23 24 25 26 27 28 29 30 31 32 33 34 35 36 37 38 39 40 41 42 43 44 45 46 47 48 1 2 3 4 5 6 7 8 9 10 11 12 13 14 15 16 17 18 19 20 21 22 23 24 25 26 27 28 29 30 31 32 33 34 35 36 37 38 39 40 41 42 43 1 2 3 4 5 6 7 8 9 10 11 12 13 14 15 16 17 18 19 20 21 22 23 24 25 26 27 28 29 30 31 32 33 34 35 36 37 38 39 40 41 42 43 44 45 46 47 48 49 50 51 52 53 54 55 56 57 58 59 60 61 1 2 3 4 5 6 7 8 9 10 11 12 13 14 15 16 17 18 19 20 21 22 23 24 25 26 27 28 29 30 31 32 33 34 35 36 37 38 39 40 41 42 43 44 45 46 47 48 49 50 51 52 53 54 55 56 57 1 2 3 4 5 6 7 8 9 10 11 12 13 14 15 16 17 18 19 20 21 22 23 24 25 26 27 28 29 30 31 32 33 34 35 36 37 38 39 40 41 42 43 44 45 46 47 48 49 Legend: Accelerated Target 20182012 2013 2014 2015 2016 2017 Guaranteed Target Construction Completion Schedules Bechtel EPC contract guaranteed project delivery dates are conservative Bechtel EPC contract includes conservative milestones for Guaranteed and Target Substantial Completion of Trains 1 and 2 Accelerated target schedule estimates first train operational in 40 months • Bechtel schedule bonus provides incentive for early delivery • Bechtel’s record delivery was Egyptian LNG train 1, delivered in 36 months from NTP GN DFCD BG DFCD KOGAS DFCD GAIL DFCD SPA CP Fulfillment Deadline T1 2013 2014 2015 2016 2017 2018 Date of First Commercial Delivery (DFCD), plus the 6 month window period, is depicted for each LNG Sale and Purchase Agreement T2 T3 T4 2012 Note: Past results not a guarantee of future performance. 29
Davis Thames, President, Cheniere Marketing Cheniere Energy Investor/Analyst Day Conference September 2012 Securing Gas Supply
Feed Gas Procurement Strategy Secure firm capacity on CTPL • Precedent agreement executed • Open season to be conducted in coming months Secure firm capacity upstream of CTPL • Ensure delivery from both west-east and east-west flow patterns • Access major liquidity points • Additional delivery points into SPL Enter into firm gas purchase agreements • Direct purchases – term, monthly, daily • AMA’s coupled with capacity release • Potential for customer-supplied feed gas 31 Note: See “Forward Looking Statements” slide.
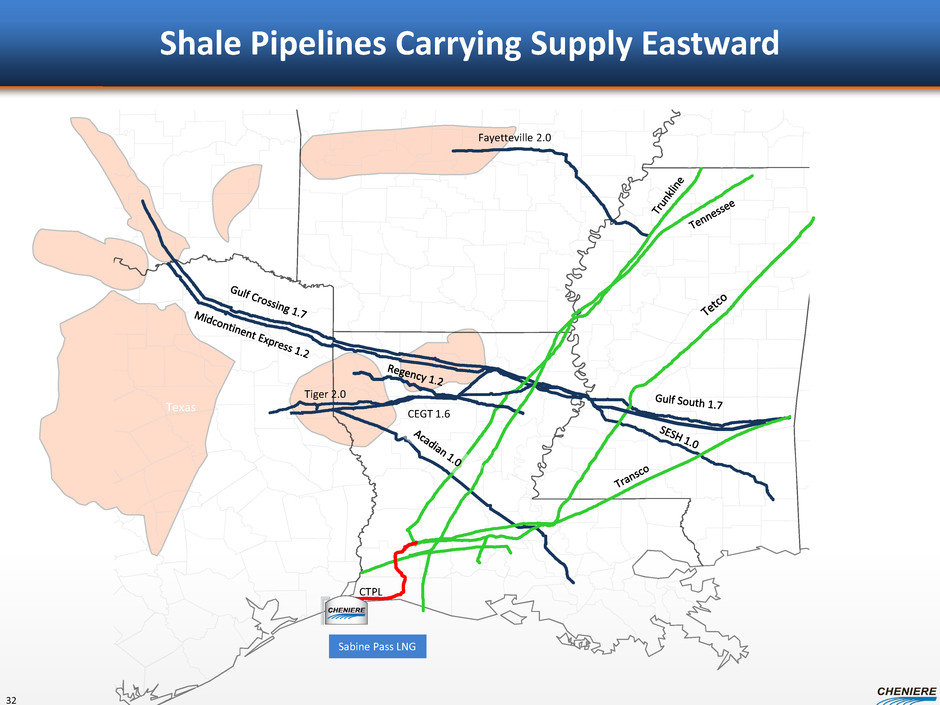
Shale Pipelines Carrying Supply Eastward Texas Oklahoma Alabama Louisiana Mississippi Arkansas Tennessee Tiger 2.0 CEGT 1.6 Fayetteville 2.0 Sabine Pass LNG CTPL 32
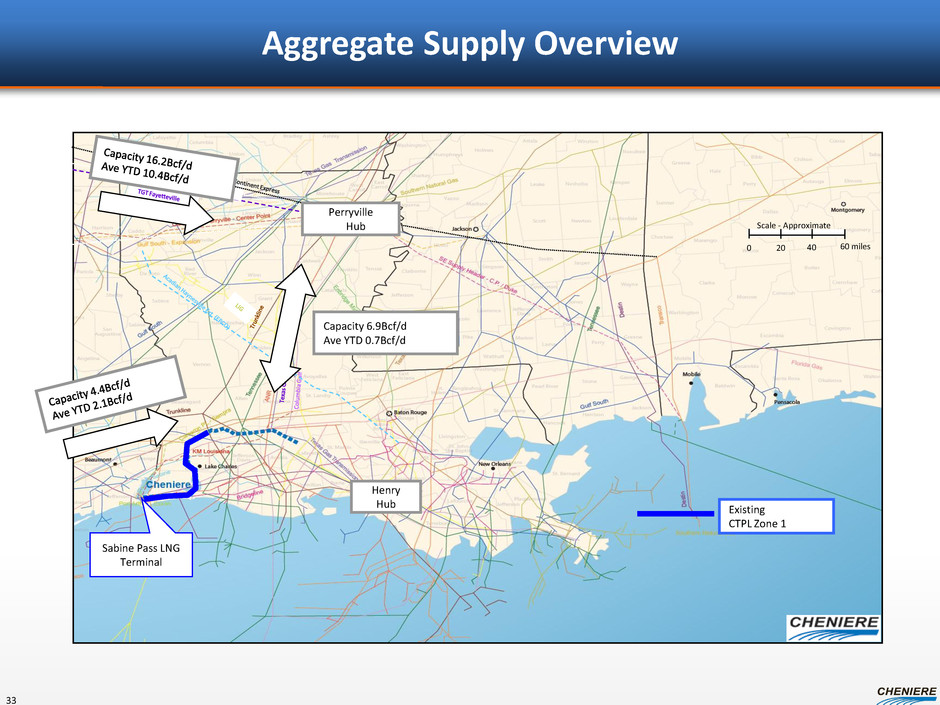
Aggregate Supply Overview Sabine Pass LNG Terminal Scale - Approximate 0 40 60 miles 20 Existing CTPL Zone 1 Henry Hub Perryville Hub Capacity 6.9Bcf/d Ave YTD 0.7Bcf/d 33
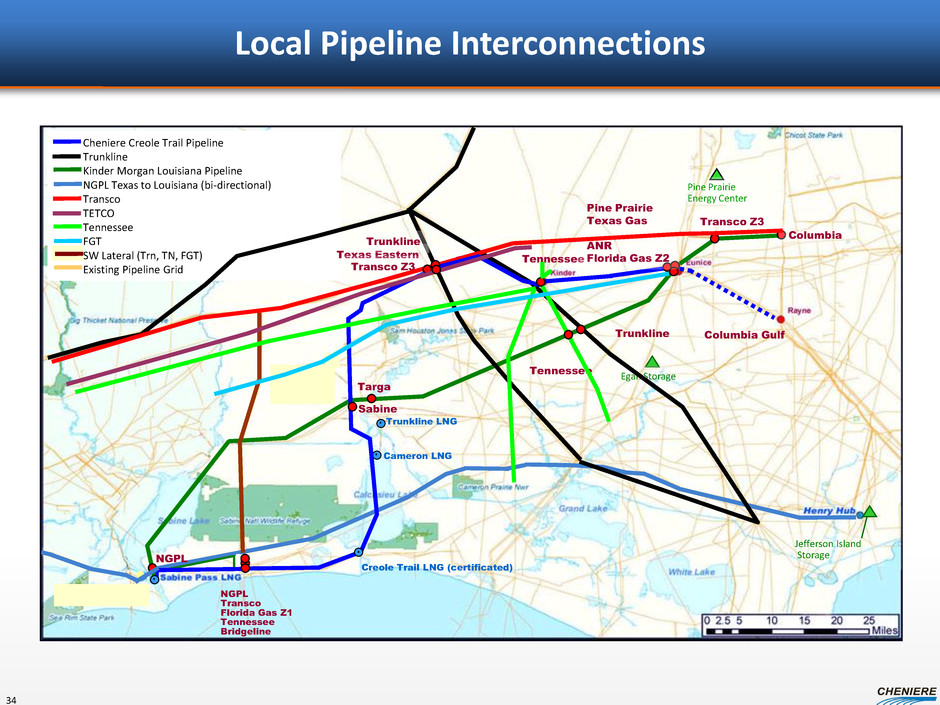
Local Pipeline Interconnections Targa Columbia Gulf Tennessee Cheniere Creole Trail Pipeline Trunkline Kinder Morgan Louisiana Pipeline NGPL Texas to Louisiana (bi-directional) Transco TETCO Tennessee FGT SW Lateral (Trn, TN, FGT) Existing Pipeline Grid Transco Z3 Sabine Pine Prairie Energy Center Egan Storage Jefferson Island Storage Creole Trail LNG (certificated) Pine Prairie Texas Gas ANR Florida Gas Z2 . Cameron LNG . Tennessee Trunkline Columbia Trunkline LNG . NGPL Transco Florida Gas Z1 Tennessee Bridgeline . NGPL Texas Eastern Trunkline Transco Z3 34
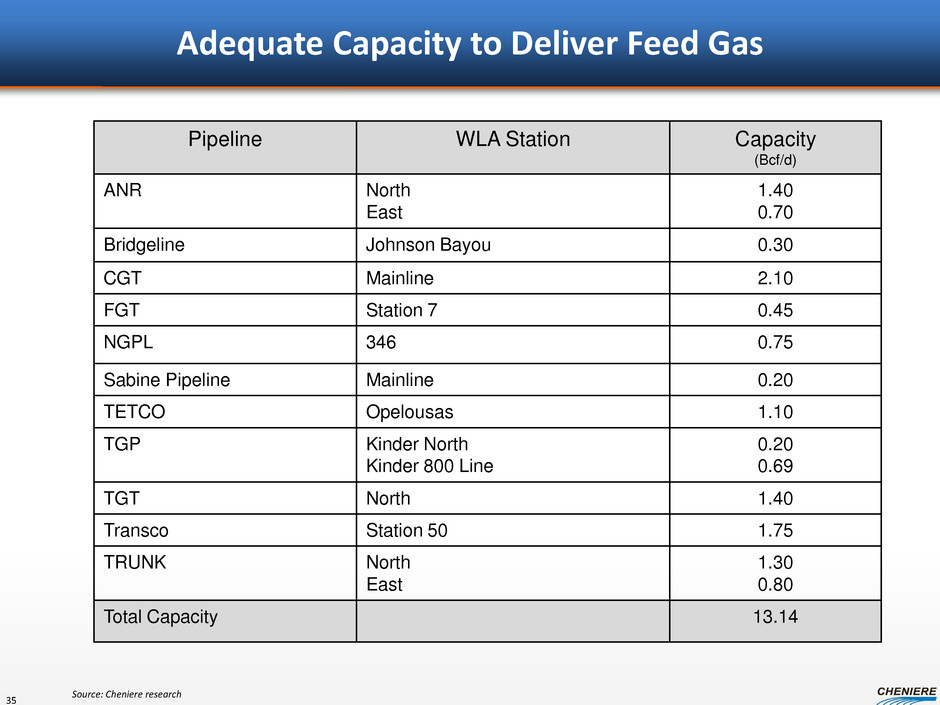
Adequate Capacity to Deliver Feed Gas Pipeline WLA Station Capacity (Bcf/d) ANR North East 1.40 0.70 Bridgeline Johnson Bayou 0.30 CGT Mainline 2.10 FGT Station 7 0.45 NGPL 346 0.75 Sabine Pipeline Mainline 0.20 TETCO Opelousas 1.10 TGP Kinder North Kinder 800 Line 0.20 0.69 TGT North 1.40 Transco Station 50 1.75 TRUNK North East 1.30 0.80 Total Capacity 13.14 35 Source: Cheniere research
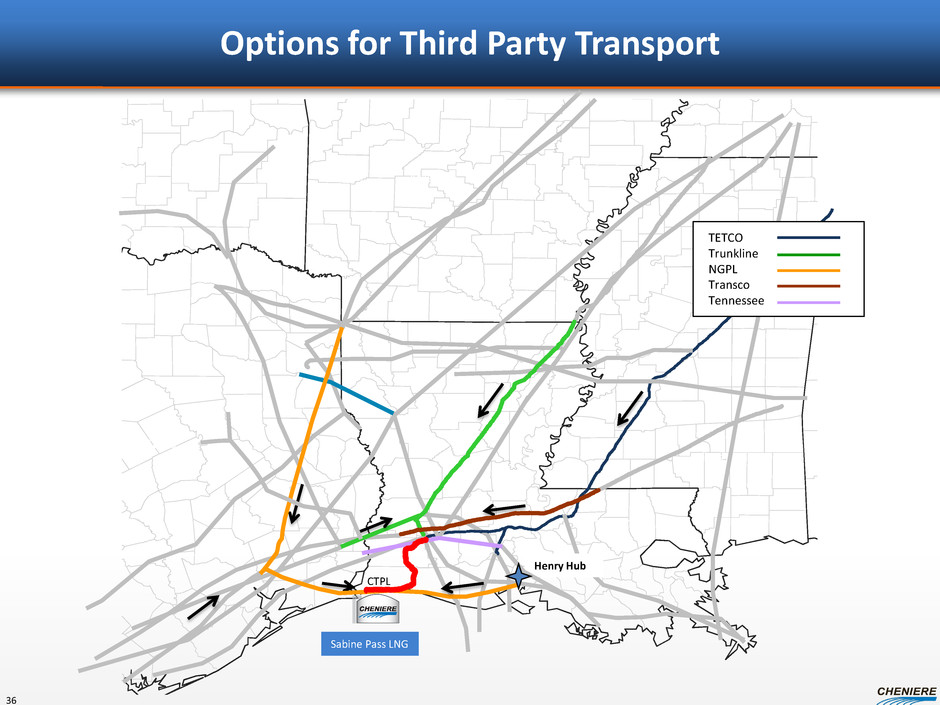
Options for Third Party Transport Texas Oklahoma Louisiana Mississippi Arkansas Tennessee Sabine Pass LNG CTPL Henry Hub TETCO Trunkline NGPL Transco Tennessee 36
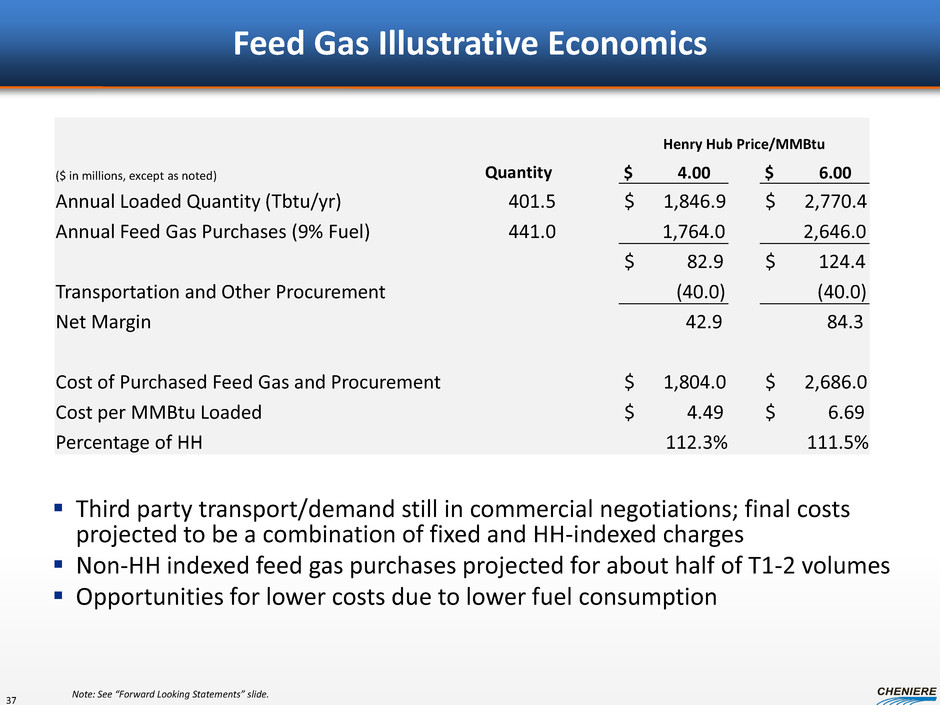
Feed Gas Illustrative Economics Third party transport/demand still in commercial negotiations; final costs projected to be a combination of fixed and HH-indexed charges Non-HH indexed feed gas purchases projected for about half of T1-2 volumes Opportunities for lower costs due to lower fuel consumption 37 Henry Hub Price/MMBtu ($ in millions, except as noted) Quantity $ 4.00 $ 6.00 Annual Loaded Quantity (Tbtu/yr) 401.5 $ 1,846.9 $ 2,770.4 Annual Feed Gas Purchases (9% Fuel) 441.0 1,764.0 2,646.0 $ 82.9 $ 124.4 Transportation and Other Procurement (40.0) (40.0) Net Margin 42.9 84.3 Cost of Purchased Feed Gas and Procurement $ 1,804.0 $ 2,686.0 Cost per MMBtu Loaded $ 4.49 $ 6.69 Percentage of HH 112.3% 111.5% Note: See “Forward Looking Statements” slide.
Davis Thames, President, Cheniere Marketing Cheniere Energy Investor/Analyst Day Conference September 2012 CMI SPA
CMI SPA – Excess Volumes at SPL CMI-SPL SPA provides CMI with up to 2 mtpa of LNG delivered FOB Sabine Pass starting with the initial production from Train 1 •Annual Quantity is determined by SPL, subject to a Maximum Annual Contract Quantity (ACQ) of 52 TBtu/yr initially and increasing to 104 TBtu/yr with T3 date of first commercial delivery (DFCD) •Once scheduled, the ACQ is firm and conventional provisions of the LNG SPAs come into effect •Determined in good faith acting as a reasonable and prudent operator (RPO) based upon production from the first four trains in excess of the firm contracts on those trains SPA sharing mechanic incents profit maximization • Sharing based on ranking of the net profit for each cargo, from highest to lowest: – Tranche 1: CMI pays SPL up to $3.00/MMBtu – Tranche 2: CMI pays SPL 20% of profits • Tranches shift at 18 TBtu for T1&T2, 36 TBtu for T3&T4 •CMI is entitled to recover all operating costs during a year before allocating profit to SPL Initial deliveries anticipated to begin as early as 4Q 2015 CMI initiating negotiations with ship owners to ensure delivery of vessels coincident with start of Train 1 39 Note: See “Forward Looking Statements” slide.
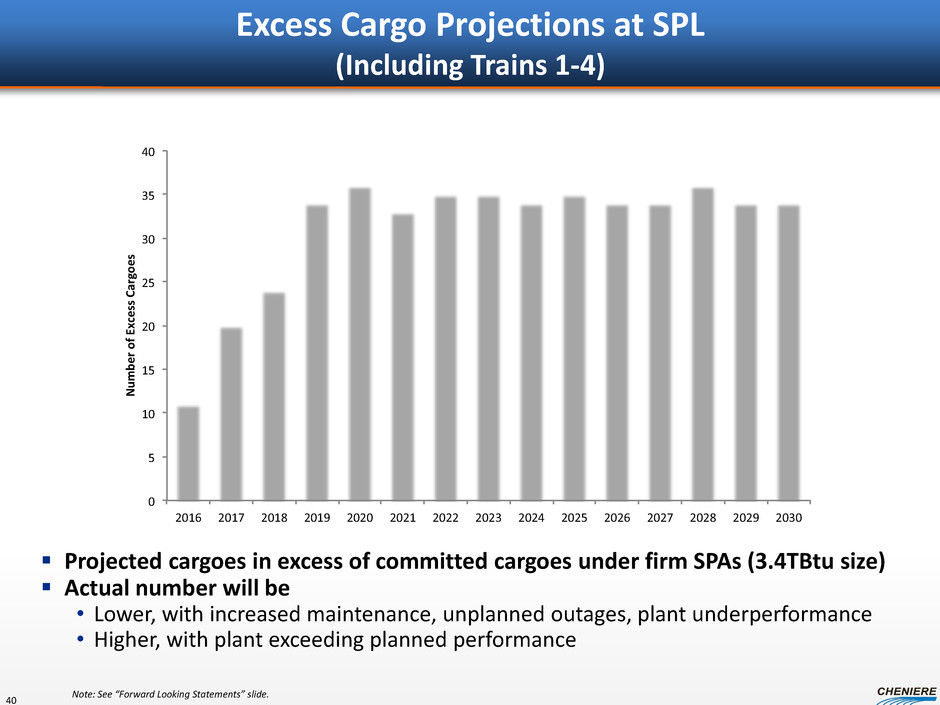
Excess Cargo Projections at SPL (Including Trains 1-4) Projected cargoes in excess of committed cargoes under firm SPAs (3.4TBtu size) Actual number will be • Lower, with increased maintenance, unplanned outages, plant underperformance • Higher, with plant exceeding planned performance 0 5 10 15 20 25 30 35 40 2016 2017 2018 2019 2020 2021 2022 2023 2024 2025 2026 2027 2028 2029 2030 Nu mb er of Ex ce ss Ca rgo es 40 Note: See “Forward Looking Statements” slide.
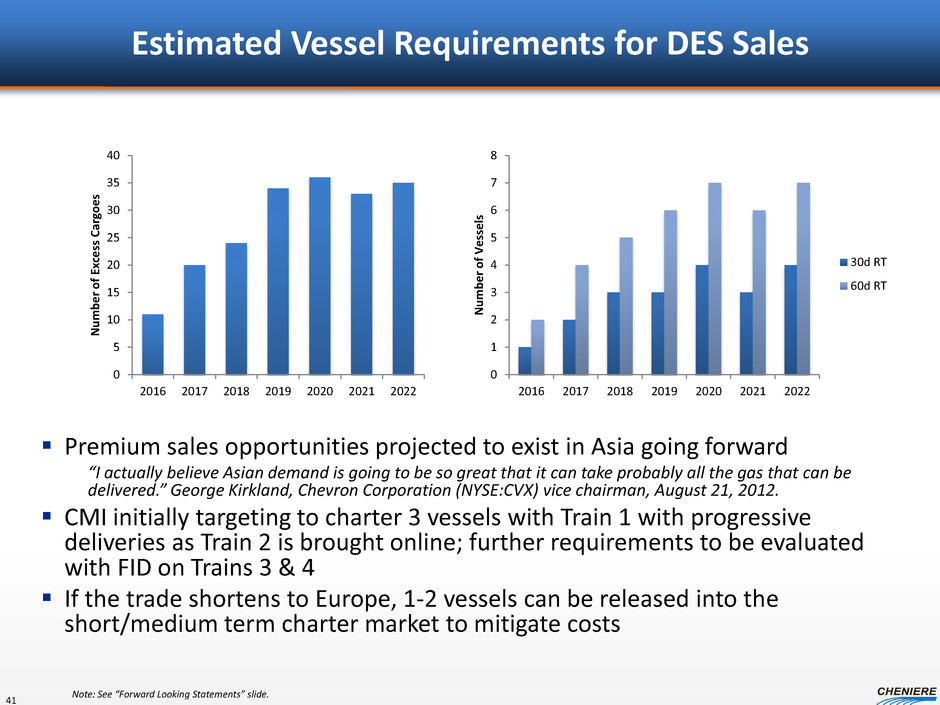
Estimated Vessel Requirements for DES Sales Premium sales opportunities projected to exist in Asia going forward “I actually believe Asian demand is going to be so great that it can take probably all the gas that can be delivered.” George Kirkland, Chevron Corporation (NYSE:CVX) vice chairman, August 21, 2012. CMI initially targeting to charter 3 vessels with Train 1 with progressive deliveries as Train 2 is brought online; further requirements to be evaluated with FID on Trains 3 & 4 If the trade shortens to Europe, 1-2 vessels can be released into the short/medium term charter market to mitigate costs 0 1 2 3 4 5 6 7 8 2016 2017 2018 2019 2020 2021 2022 N u m b e r o f Vessel s 30d RT 60d RT 0 5 10 15 20 25 30 35 40 2016 2017 2018 2019 2020 2021 2022 N u m b e r o f Exc e ss Ca rg o e s 41 Note: See “Forward Looking Statements” slide.
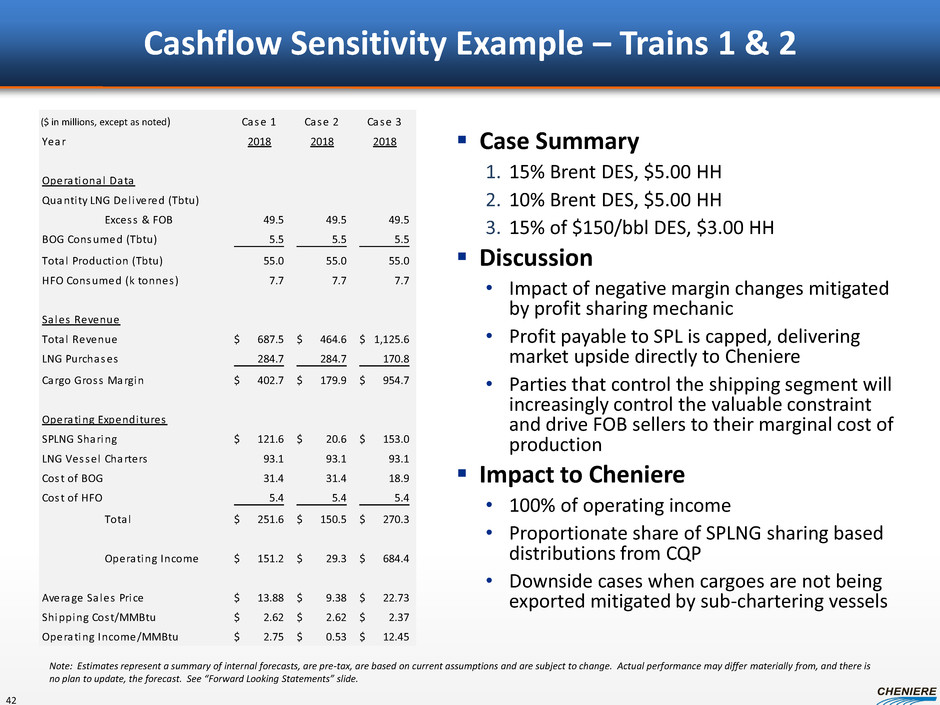
Cashflow Sensitivity Example – Trains 1 & 2 Case Summary 1. 15% Brent DES, $5.00 HH 2. 10% Brent DES, $5.00 HH 3. 15% of $150/bbl DES, $3.00 HH Discussion • Impact of negative margin changes mitigated by profit sharing mechanic • Profit payable to SPL is capped, delivering market upside directly to Cheniere • Parties that control the shipping segment will increasingly control the valuable constraint and drive FOB sellers to their marginal cost of production Impact to Cheniere • 100% of operating income • Proportionate share of SPLNG sharing based distributions from CQP • Downside cases when cargoes are not being exported mitigated by sub-chartering vessels Case 1 Case 2 Case 3 Year 2018 2018 2018 Operational Data Quantity LNG Del ivered (Tbtu) Excess & FOB 49.5 49.5 49.5 BOG Consumed (Tbtu) 5.5 5.5 5.5 Tota l Production (Tbtu) 55.0 55.0 55.0 HFO Consumed (k tonnes) 7.7 7.7 7.7 Sa les Revenue Total Revenue 687.5$ 464.6$ 1,125.6$ LNG Purchases 284.7 284.7 170.8 Cargo Gross Margin 402.7$ 179.9$ 954.7$ Operating Expenditures SPLNG Sharing 121.6$ 20.6$ 153.0$ LNG Vessel Charters 93.1 93.1 93.1 Cost of BOG 31.4 31.4 18.9 Cost of HFO 5.4 5.4 5.4 Tota l 251.6$ 150.5$ 270.3$ Operating Income 151.2$ 29.3$ 684.4$ Average Sa les Price 13.88$ 9.38$ 22.73$ Shipping Cost/MMBtu 2.62$ 2.62$ 2.37$ Operating Income/MMBtu 2.75$ 0.53$ 12.45$ 42 ($ in millions, except as noted) Note: Estimates represent a summary of internal forecasts, are pre-tax, are based on current assumptions and are subject to change. Actual performance may differ materially from, and there is no plan to update, the forecast. See “Forward Looking Statements” slide.
Corpus Christi Liquefaction Project Michael Wortley, Vice President - Business Development Cheniere Energy Investor/Analyst Day Conference September 2012
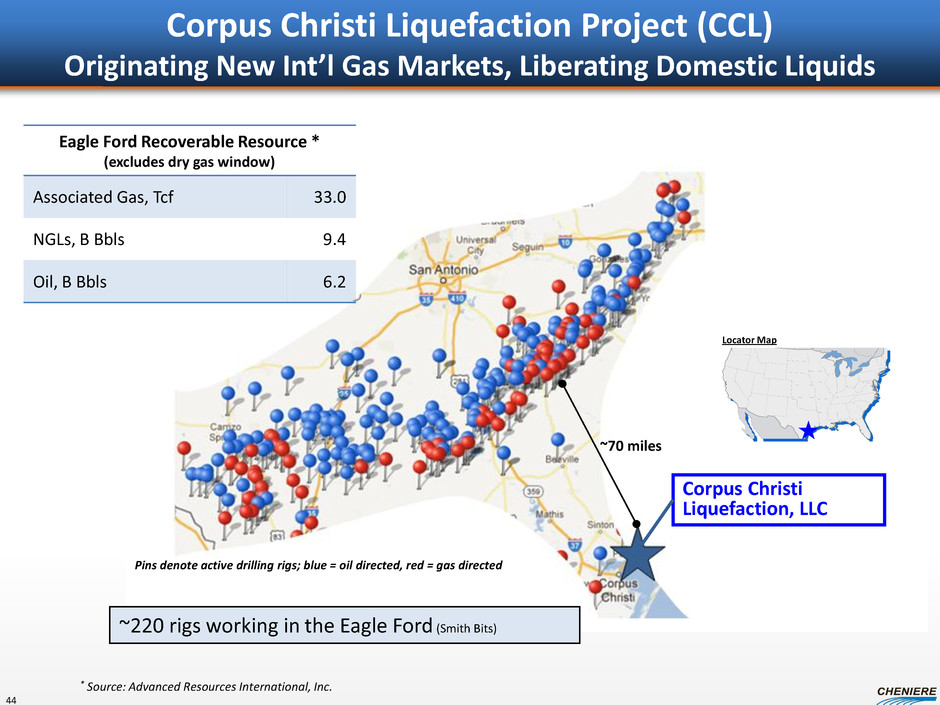
Corpus Christi Liquefaction Project (CCL) Originating New Int’l Gas Markets, Liberating Domestic Liquids ~220 rigs working in the Eagle Ford (Smith Bits) Locator Map Corpus Christi Liquefaction, LLC Eagle Ford Recoverable Resource * (excludes dry gas window) Associated Gas, Tcf 33.0 NGLs, B Bbls 9.4 Oil, B Bbls 6.2 ~70 miles * Source: Advanced Resources International, Inc. Pins denote active drilling rigs; blue = oil directed, red = gas directed 44
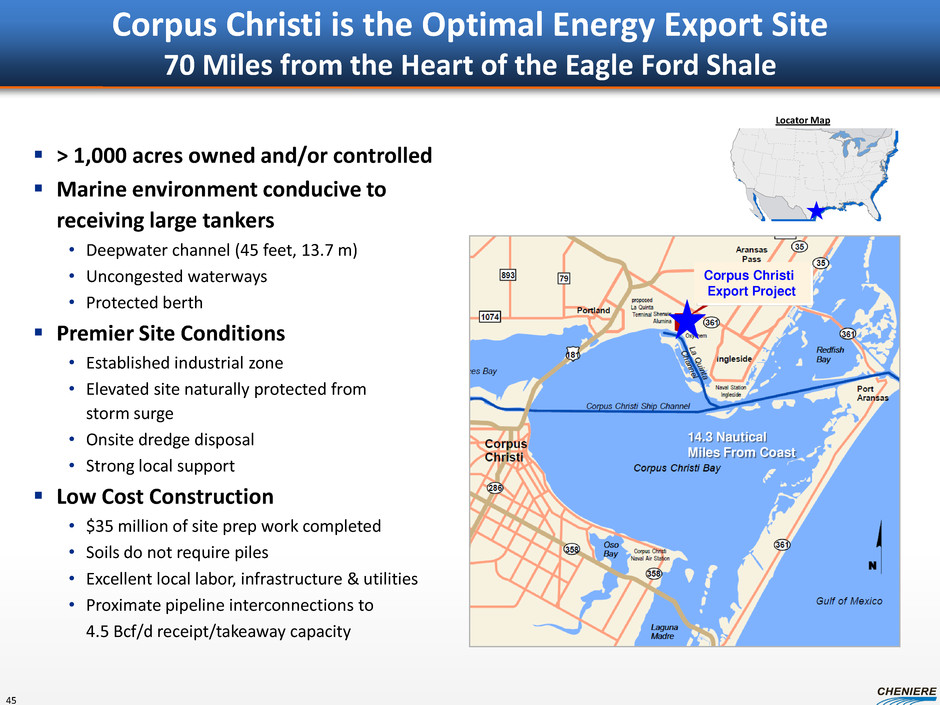
Corpus Christi is the Optimal Energy Export Site 70 Miles from the Heart of the Eagle Ford Shale > 1,000 acres owned and/or controlled Marine environment conducive to receiving large tankers • Deepwater channel (45 feet, 13.7 m) • Uncongested waterways • Protected berth Premier Site Conditions • Established industrial zone • Elevated site naturally protected from storm surge • Onsite dredge disposal • Strong local support Low Cost Construction • $35 million of site prep work completed • Soils do not require piles • Excellent local labor, infrastructure & utilities • Proximate pipeline interconnections to 4.5 Bcf/d receipt/takeaway capacity 14.3 Nautical Miles From Coast Corpus Christi Export Project Locator Map 45
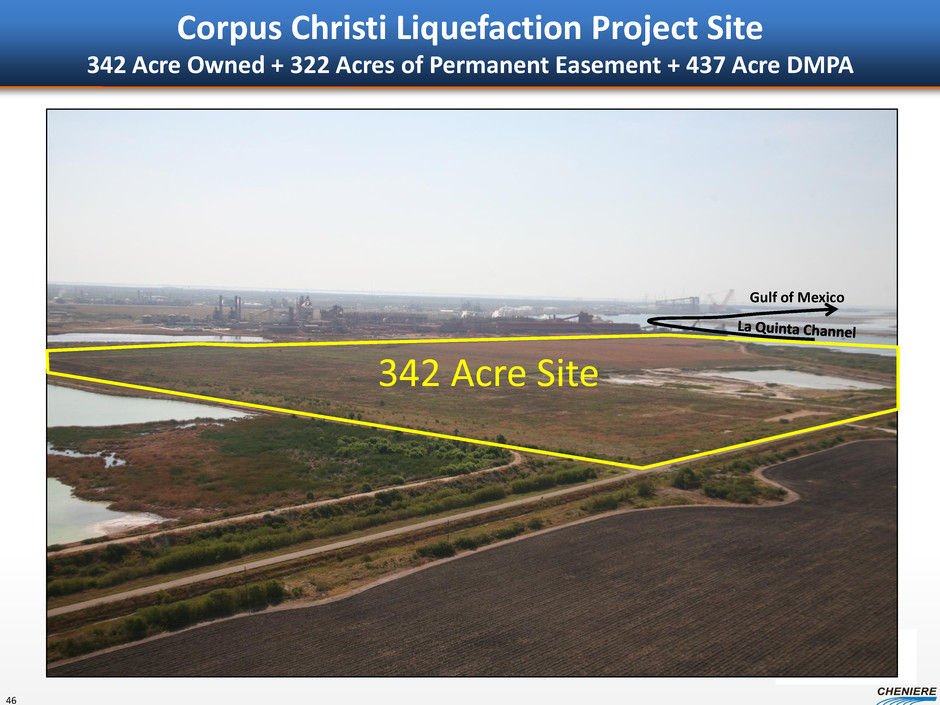
Corpus Christi Liquefaction Project Site 342 Acre Owned + 322 Acres of Permanent Easement + 437 Acre DMPA 342 Acre Site Gulf of Mexico 46
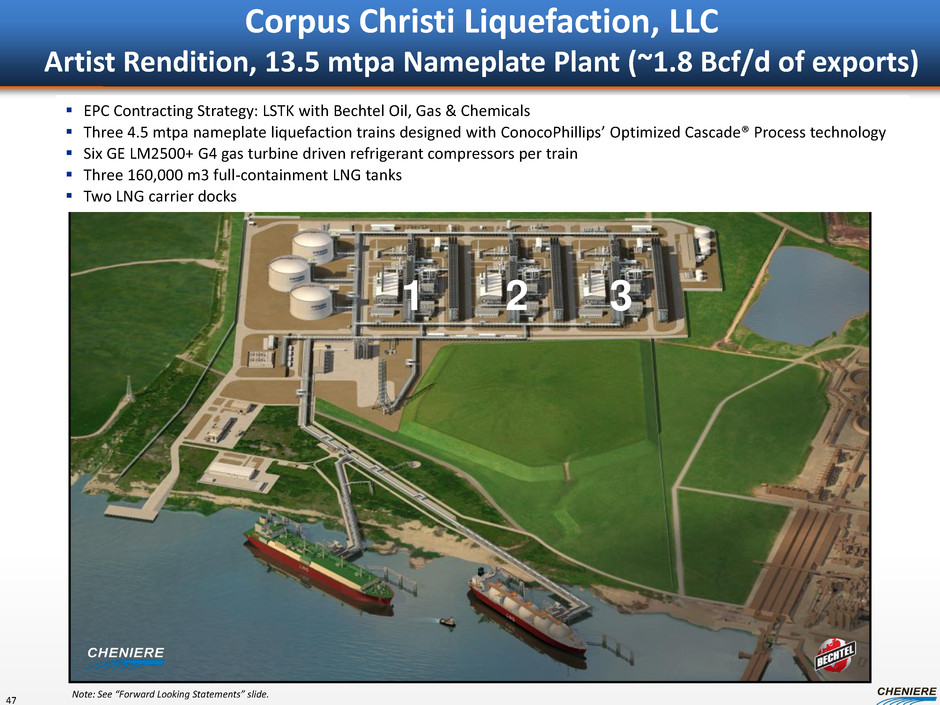
1 2 3 EPC Contracting Strategy: LSTK with Bechtel Oil, Gas & Chemicals Three 4.5 mtpa nameplate liquefaction trains designed with ConocoPhillips’ Optimized Cascade® Process technology Six GE LM2500+ G4 gas turbine driven refrigerant compressors per train Three 160,000 m3 full-containment LNG tanks Two LNG carrier docks Corpus Christi Liquefaction, LLC Artist Rendition, 13.5 mtpa Nameplate Plant (~1.8 Bcf/d of exports) Note: See “Forward Looking Statements” slide. 47
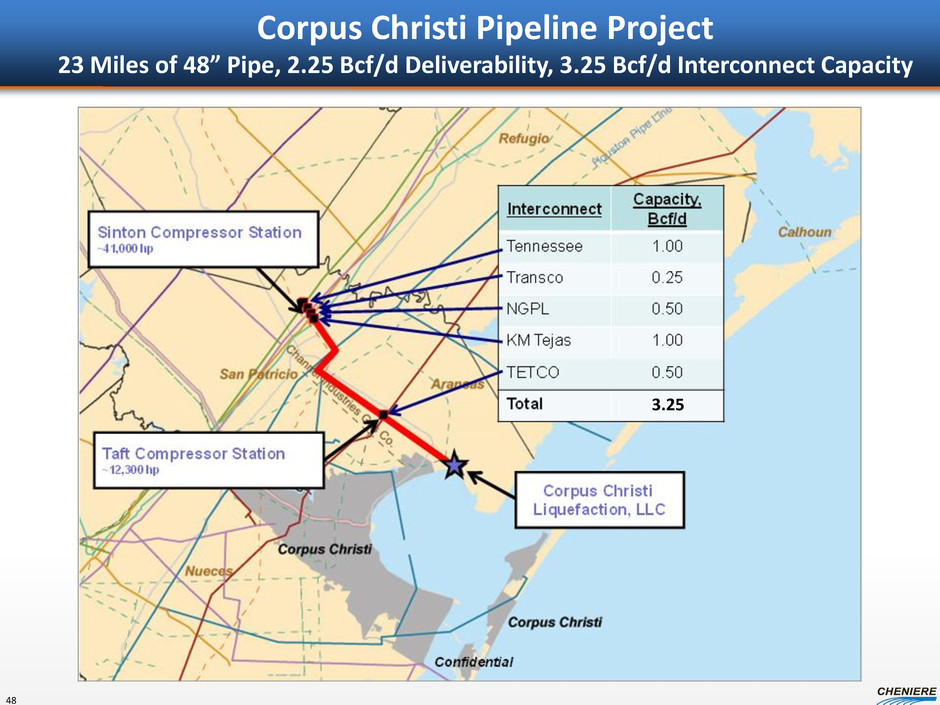
Corpus Christi Pipeline Project 23 Miles of 48” Pipe, 2.25 Bcf/d Deliverability, 3.25 Bcf/d Interconnect Capacity 48 3.25
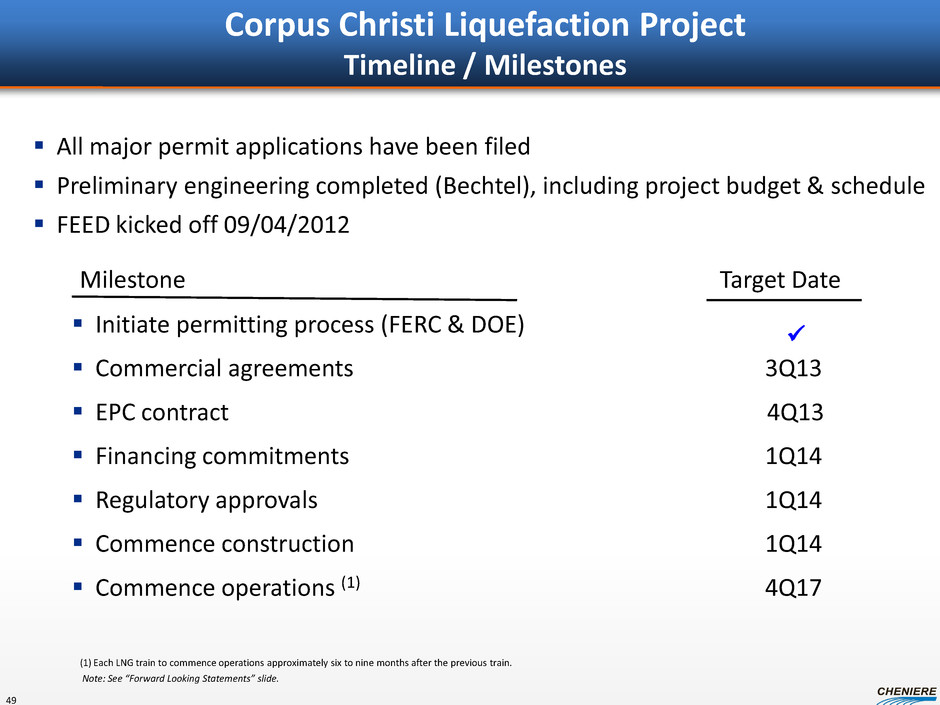
Corpus Christi Liquefaction Project Timeline / Milestones All major permit applications have been filed Preliminary engineering completed (Bechtel), including project budget & schedule FEED kicked off 09/04/2012 Initiate permitting process (FERC & DOE) Commercial agreements 3Q13 EPC contract 4Q13 Financing commitments 1Q14 Regulatory approvals 1Q14 Commence construction 1Q14 Commence operations (1) 4Q17 Milestone Target Date (1) Each LNG train to commence operations approximately six to nine months after the previous train. Note: See “Forward Looking Statements” slide. 49
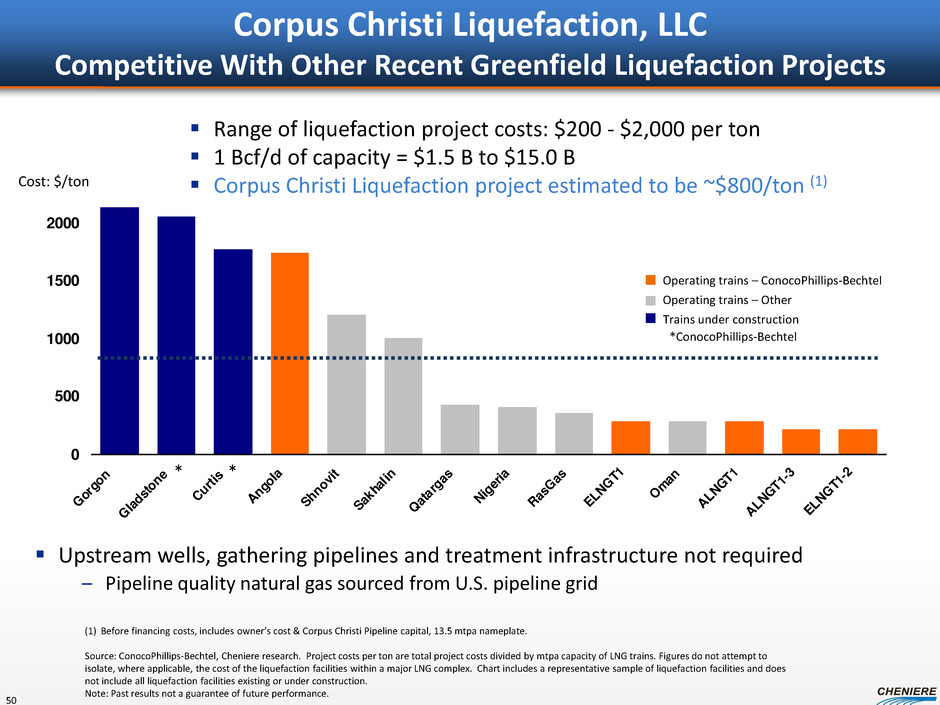
0 500 1000 1500 2000 Go rgo n Gla dst on e Cu rtis An gol a Sh no vit Sak hal in Qa tar gas Nig eria Ra sG as EL NG T1 Om an AL NG T1 AL NG T1- 3 EL NG T1- 2 Corpus Christi Liquefaction, LLC Competitive With Other Recent Greenfield Liquefaction Projects (1) Before financing costs, includes owner’s cost & Corpus Christi Pipeline capital, 13.5 mtpa nameplate. Source: ConocoPhillips-Bechtel, Cheniere research. Project costs per ton are total project costs divided by mtpa capacity of LNG trains. Figures do not attempt to isolate, where applicable, the cost of the liquefaction facilities within a major LNG complex. Chart includes a representative sample of liquefaction facilities and does not include all liquefaction facilities existing or under construction. Note: Past results not a guarantee of future performance. *ConocoPhillips-Bechtel Cost: $/ton Upstream wells, gathering pipelines and treatment infrastructure not required – Pipeline quality natural gas sourced from U.S. pipeline grid Trains under construction Range of liquefaction project costs: $200 - $2,000 per ton 1 Bcf/d of capacity = $1.5 B to $15.0 B Corpus Christi Liquefaction project estimated to be ~$800/ton (1) * * Operating trains – ConocoPhillips-Bechtel Operating trains – Other 50
Davis Thames, President, Cheniere Marketing Cheniere Energy Investor/Analyst Day Conference September 2012 Corpus Christi Marketing Plan
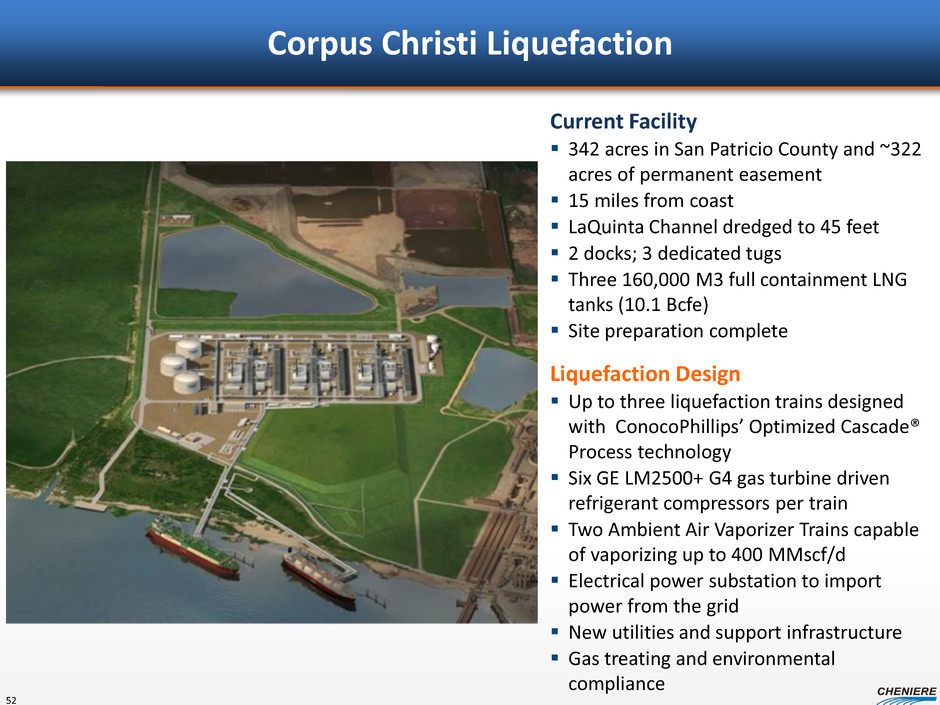
Corpus Christi Liquefaction Current Facility 342 acres in San Patricio County and ~322 acres of permanent easement 15 miles from coast LaQuinta Channel dredged to 45 feet 2 docks; 3 dedicated tugs Three 160,000 M3 full containment LNG tanks (10.1 Bcfe) Site preparation complete Liquefaction Design Up to three liquefaction trains designed with ConocoPhillips’ Optimized Cascade® Process technology Six GE LM2500+ G4 gas turbine driven refrigerant compressors per train Two Ambient Air Vaporizer Trains capable of vaporizing up to 400 MMscf/d Electrical power substation to import power from the grid New utilities and support infrastructure Gas treating and environmental compliance 52
Key Success Factors Proven commercial model • Henry Hub indexation with flexibility • Proven financeable One of only two companies that have invested funds to prepare and file both FERC and DOE applications(1) Low execution risk through duplication of the Sabine Pass design Significant commercial demand that could not be satisfied during the Sabine Pass marketing effort Cheniere is recognized as the only company to have successfully navigated the US regulatory process to obtain DOE export license and all of the approvals rolled into a FERC license (1) DOE Applications filed by CMI. 53
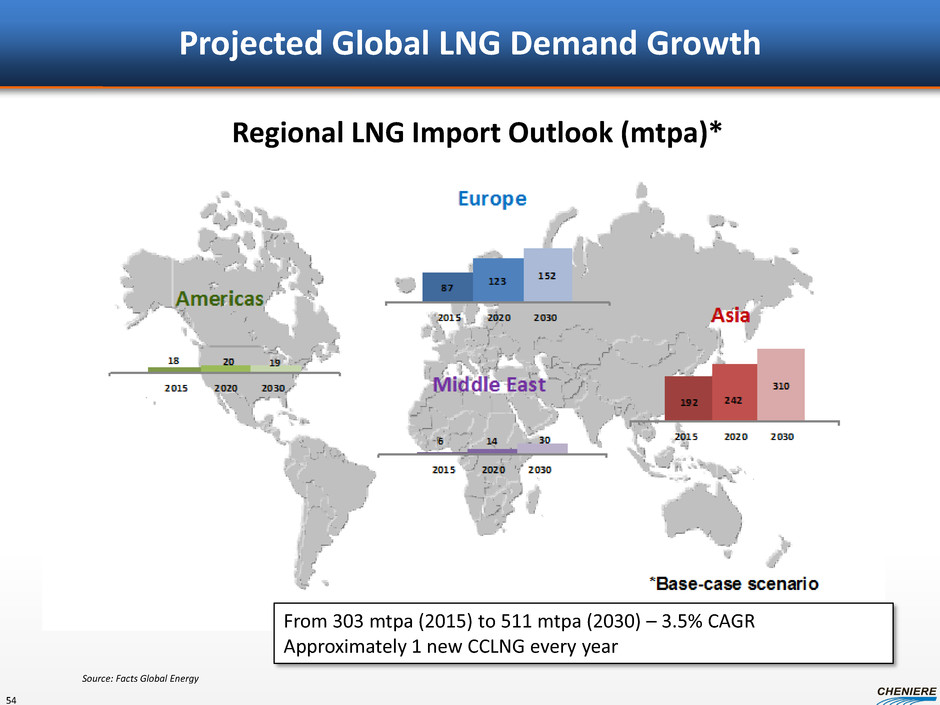
Projected Global LNG Demand Growth 54 From 303 mtpa (2015) to 511 mtpa (2030) – 3.5% CAGR Approximately 1 new CCLNG every year Regional LNG Import Outlook (mtpa)* Source: Facts Global Energy
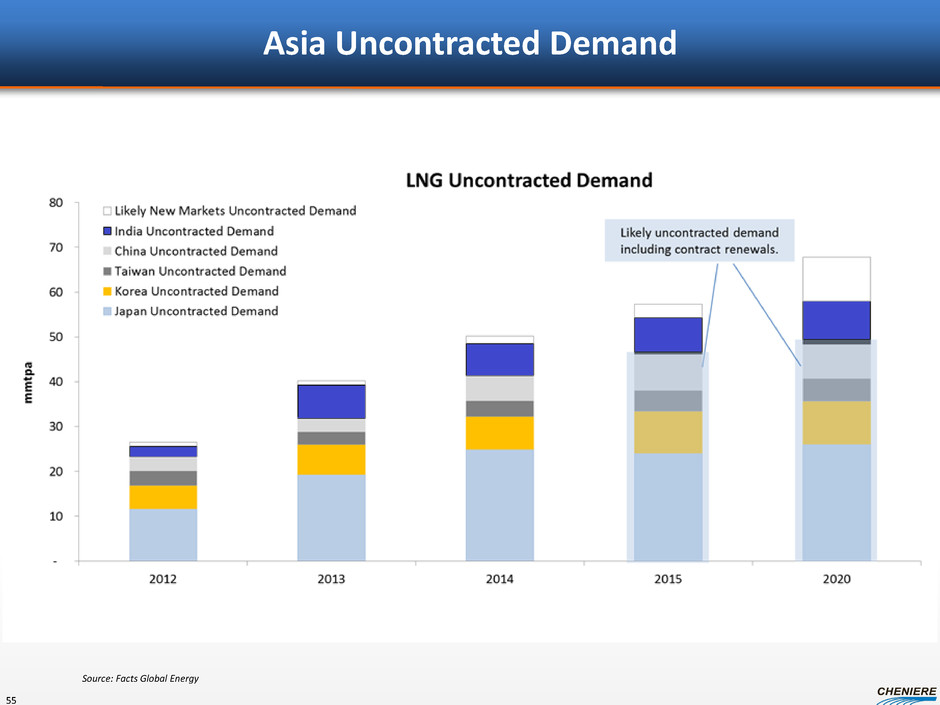
Asia Uncontracted Demand 55 Source: Facts Global Energy
CCLNG Public Interest Benefits Significant economic impact • $31.1 billion cumulative direct economic impact • $111.4 billion cumulative indirect economic impact • 96,954 jobs created nationwide Complementary benefits to the chemicals industry • $90.1 billion in cumulative benefits resulting from CCLNG • 34,003 jobs over 25 years Negligible effect on the resource base • 2,915 Tcf of technically recoverable reserves – 120 years of supply • Projected to increase 216 Tcf by 2035 • CCLNG exports would only be 7.4% of the projected increase Other benefits • Reduced price volatility • Complementary production of tight oil, ethane and other feedstocks • Markets to consume gas that is currently being flared 56 Source: Cheniere’s DOE application dated August 31, 2012 Note: See “Forward Looking Statements” slide.
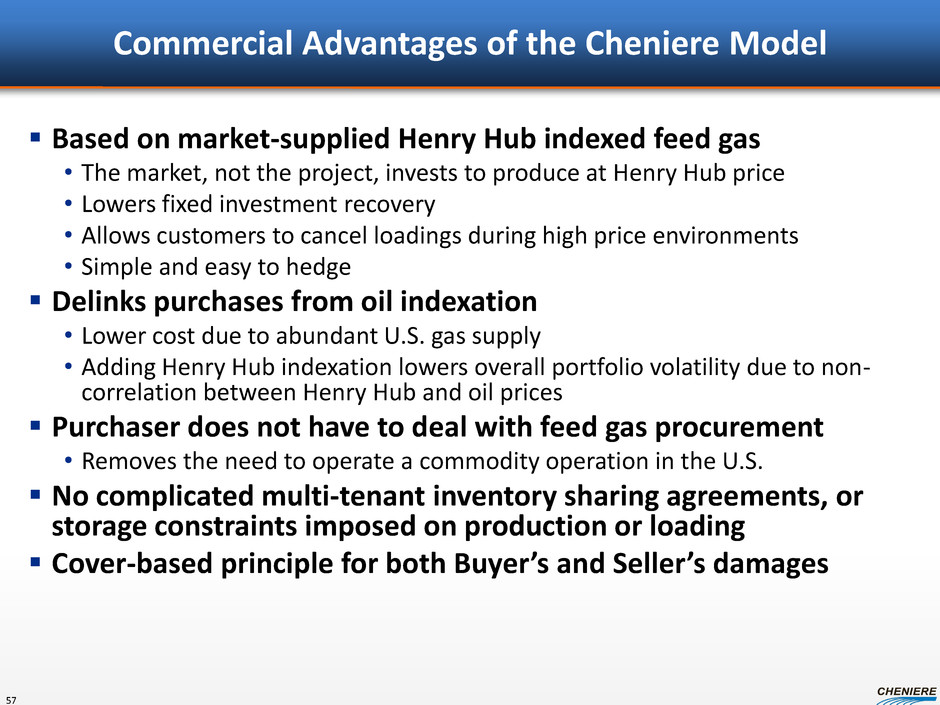
Commercial Advantages of the Cheniere Model Based on market-supplied Henry Hub indexed feed gas • The market, not the project, invests to produce at Henry Hub price • Lowers fixed investment recovery • Allows customers to cancel loadings during high price environments • Simple and easy to hedge Delinks purchases from oil indexation • Lower cost due to abundant U.S. gas supply • Adding Henry Hub indexation lowers overall portfolio volatility due to non- correlation between Henry Hub and oil prices Purchaser does not have to deal with feed gas procurement • Removes the need to operate a commodity operation in the U.S. No complicated multi-tenant inventory sharing agreements, or storage constraints imposed on production or loading Cover-based principle for both Buyer’s and Seller’s damages 57
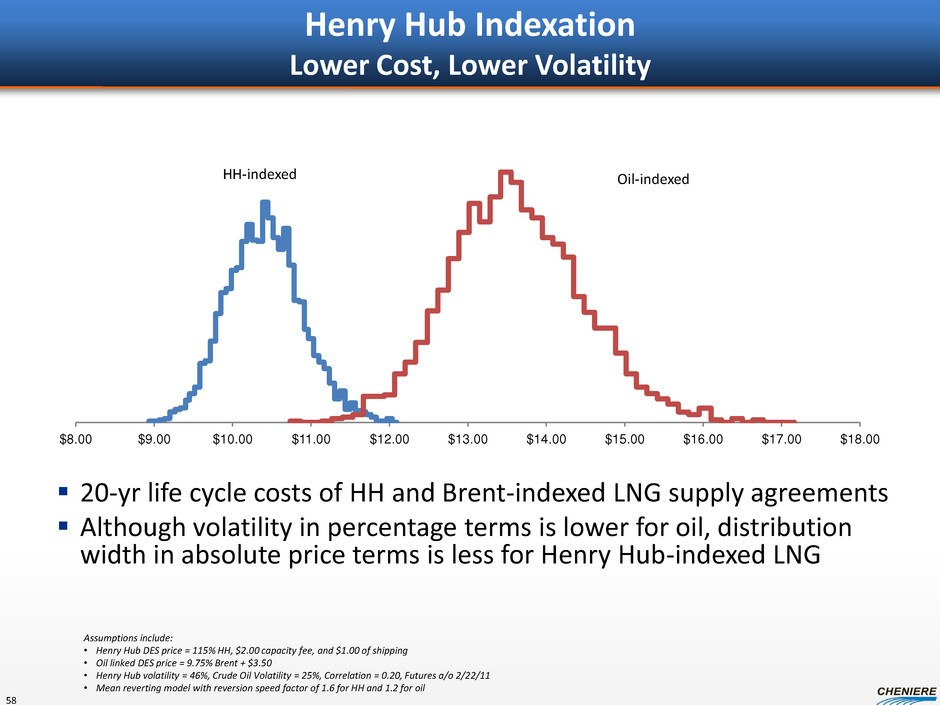
Henry Hub Indexation Lower Cost, Lower Volatility 20-yr life cycle costs of HH and Brent-indexed LNG supply agreements Although volatility in percentage terms is lower for oil, distribution width in absolute price terms is less for Henry Hub-indexed LNG $8.00 $9.00 $10.00 $11.00 $12.00 $13.00 $14.00 $15.00 $16.00 $17.00 $18.00 HH-indexed Oil-indexed 58 Assumptions include: • Henry Hub DES price = 115% HH, $2.00 capacity fee, and $1.00 of shipping • Oil linked DES price = 9.75% Brent + $3.50 • Henry Hub volatility = 46%, Crude Oil Volatility = 25%, Correlation = 0.20, Futures a/o 2/22/11 • Mean reverting model with reversion speed factor of 1.6 for HH and 1.2 for oil
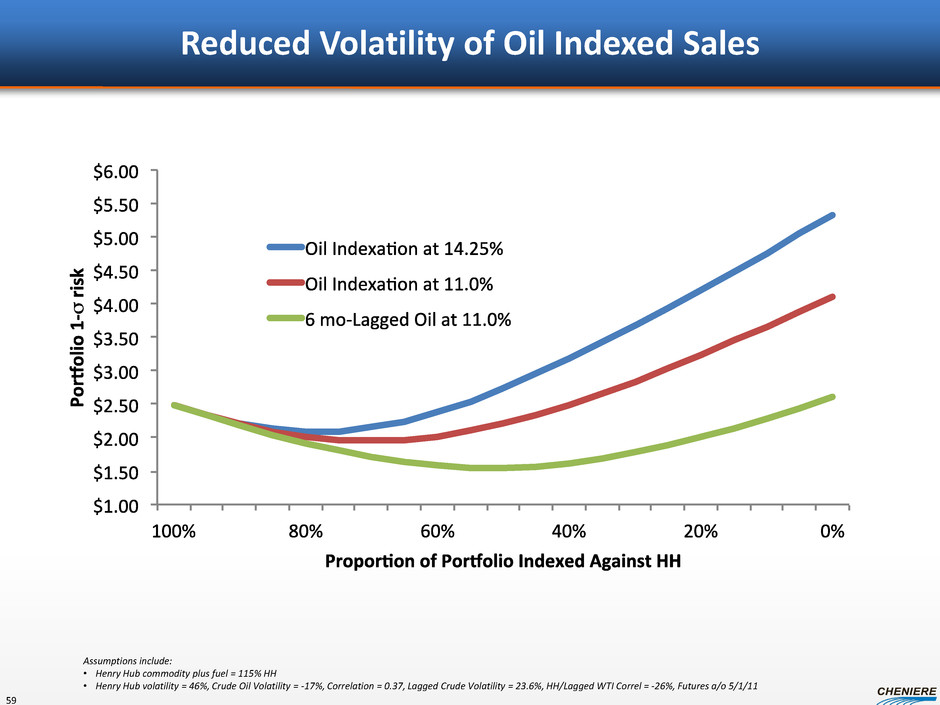
Reduced Volatility of Oil Indexed Sales Assumptions include: • Henry Hub commodity plus fuel = 115% HH • Henry Hub volatility = 46%, Crude Oil Volatility = -17%, Correlation = 0.37, Lagged Crude Volatility = 23.6%, HH/Lagged WTI Correl = -26%, Futures a/o 5/1/11 59
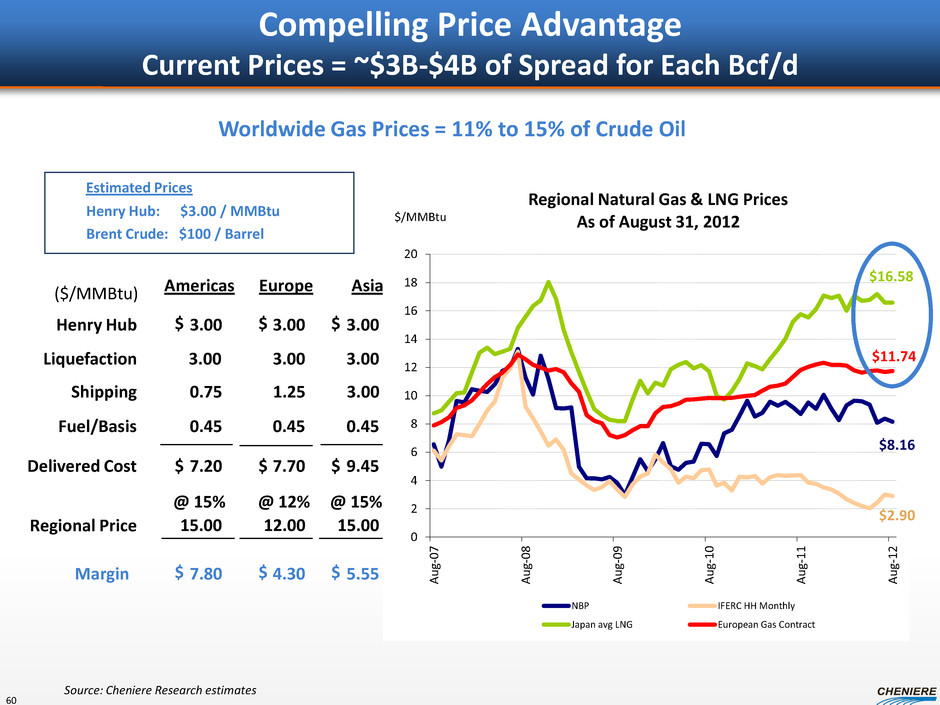
Estimated Prices Henry Hub: $3.00 / MMBtu Brent Crude: $100 / Barrel ($/MMBtu) Americas Europe Asia Henry Hub 3.00 $ 3.00 3.00 Fuel/Basis Shipping 0.75 1.25 3.00 0.45 0.45 0.45 $ 7.20 7.70 9.45 5.55 Regional Price @ 15% 15.00 12.00 15.00 Margin 7.80 $ 4.30 Liquefaction 3.00 3.00 3.00 Delivered Cost Source: Cheniere Research estimates Compelling Price Advantage Current Prices = ~$3B-$4B of Spread for Each Bcf/d @ 12% @ 15% $ $ $ $ $ $ Worldwide Gas Prices = 11% to 15% of Crude Oil 0 2 4 6 8 10 12 14 16 18 20 Au g- 0 7 Au g- 0 8 Au g- 0 9 Au g- 1 0 Au g- 1 1 Au g- 1 2 $/MMBtu Regional Natural Gas & LNG Prices As of August 31, 2012 NBP IFERC HH Monthly Japan avg LNG European Gas Contract $2.90 $8.16 $11.74 $16.58 60
Corporate Strategy Charif Souki, Chairman & CEO Cheniere Energy Investor/Analyst Day Conference September 2012 61
Cheniere is projected to have significant, stable earnings and cash flows underpinned with long-term customer contracts We have decided not to jeopardize the earnings from existing business at Sabine Pass No more stock or debt will be issued at the corporate level unless exceptional opportunities/circumstances Maintaining a Stable Risk Profile at Cheniere 62
Implementing Dividend for LNG Shares Estimated LNG shares outstanding YE2016 • ~240-250MM Able to commence dividends in 2016 subject to approval by Board of Directors • ~$0.50/share ($2.00 annualized) Note: See “Forward Looking Statements” slide. 63
Cheniere Marketing • LNG exports / sales opportunities – 2.0 mtpa at SPL – Additional volumes from Corpus Christi Corpus Christi Liquefaction Project • 13.5 mtpa nameplate capacity Future Development Opportunities 64
Management has recommended, and the Board has approved, that future development projects, Cheniere Marketing and Corpus Christi Liquefaction will be financed at the project level on a non- recourse basis • Management expects to participate in the development of future projects • Corpus Christi Project could be a drop-down asset for CQP Future Development Projects 65
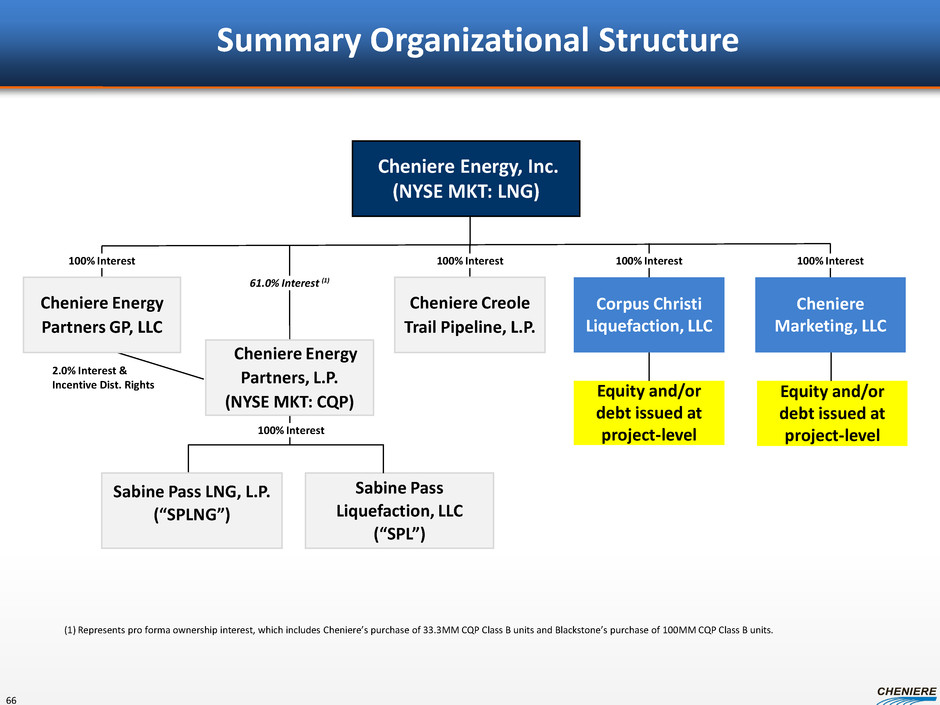
2.0% Interest & Incentive Dist. Rights Cheniere Energy, Inc. (NYSE MKT: LNG) Sabine Pass LNG, L.P. (“SPLNG”) Sabine Pass Liquefaction, LLC (“SPL”) Cheniere Energy Partners, L.P. (NYSE MKT: CQP) Cheniere Creole Trail Pipeline, L.P. Corpus Christi Liquefaction, LLC Cheniere Marketing, LLC Cheniere Energy Partners GP, LLC 61.0% Interest (1) 100% Interest 100% Interest 100% Interest 100% Interest 100% Interest (1) Represents pro forma ownership interest, which includes Cheniere’s purchase of 33.3MM CQP Class B units and Blackstone’s purchase of 100MM CQP Class B units. Summary Organizational Structure Equity and/or debt issued at project-level Equity and/or debt issued at project-level 66
Appendix Cheniere Energy Investor/Analyst Day Conference September 2012
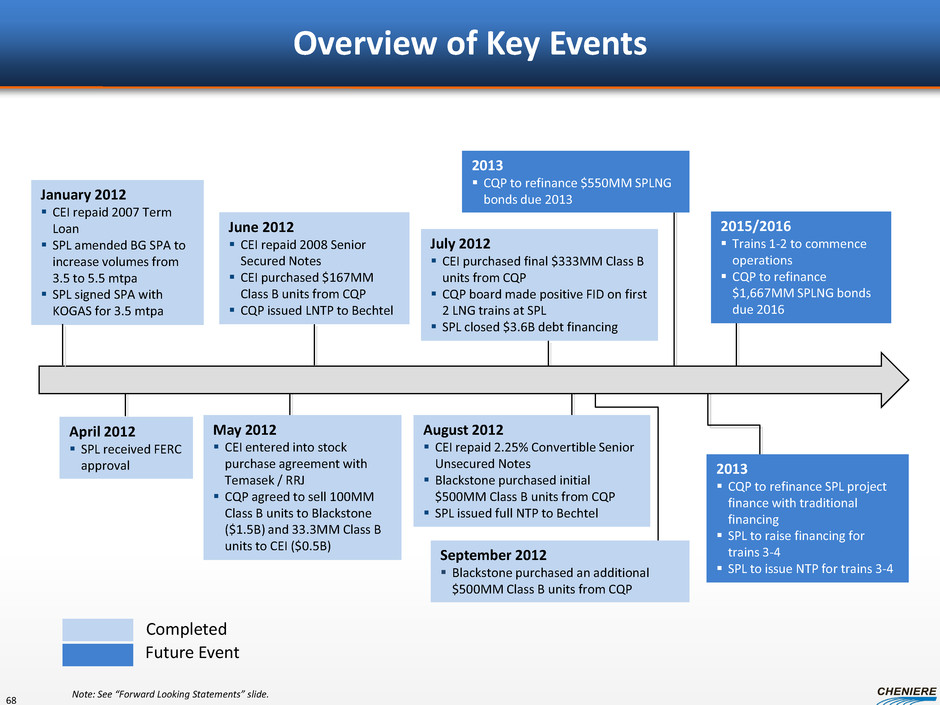
Overview of Key Events January 2012 CEI repaid 2007 Term Loan SPL amended BG SPA to increase volumes from 3.5 to 5.5 mtpa SPL signed SPA with KOGAS for 3.5 mtpa April 2012 SPL received FERC approval May 2012 CEI entered into stock purchase agreement with Temasek / RRJ CQP agreed to sell 100MM Class B units to Blackstone ($1.5B) and 33.3MM Class B units to CEI ($0.5B) Completed Future Event June 2012 CEI repaid 2008 Senior Secured Notes CEI purchased $167MM Class B units from CQP CQP issued LNTP to Bechtel July 2012 CEI purchased final $333MM Class B units from CQP CQP board made positive FID on first 2 LNG trains at SPL SPL closed $3.6B debt financing August 2012 CEI repaid 2.25% Convertible Senior Unsecured Notes Blackstone purchased initial $500MM Class B units from CQP SPL issued full NTP to Bechtel 2013 CQP to refinance $550MM SPLNG bonds due 2013 2013 CQP to refinance SPL project finance with traditional financing SPL to raise financing for trains 3-4 SPL to issue NTP for trains 3-4 2015/2016 Trains 1-2 to commence operations CQP to refinance $1,667MM SPLNG bonds due 2016 Note: See “Forward Looking Statements” slide. 68 September 2012 Blackstone purchased an additional $500MM Class B units from CQP
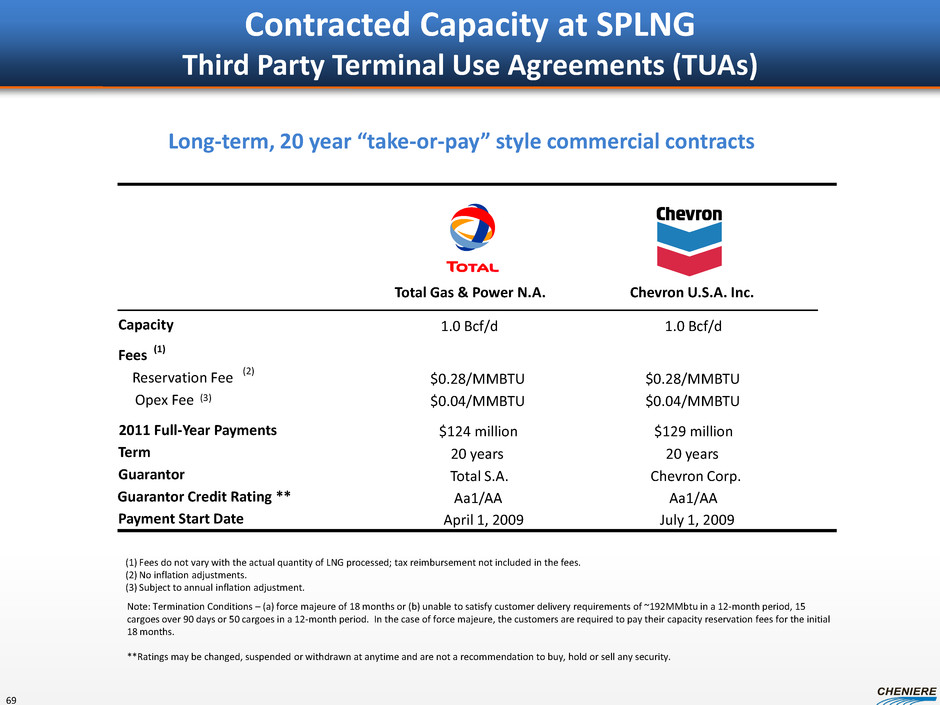
Contracted Capacity at SPLNG Third Party Terminal Use Agreements (TUAs) Long-term, 20 year “take-or-pay” style commercial contracts Total Gas & Power N.A. Chevron U.S.A. Inc. Capacity 1.0 Bcf/d 1.0 Bcf/d Fees (1) Reservation Fee (2) $0.28/MMBTU $0.28/MMBTU Opex Fee (3) $0.04/MMBTU $0.04/MMBTU 2011 Full-Year Payments $124 million $129 million Term 20 years 20 years Guarantor Total S.A. Chevron Corp. Guarantor Credit Rating ** Aa1/AA Aa1/AA Payment Start Date April 1, 2009 July 1, 2009 (1) Fees do not vary with the actual quantity of LNG processed; tax reimbursement not included in the fees. (2) No inflation adjustments. (3) Subject to annual inflation adjustment. Note: Termination Conditions – (a) force majeure of 18 months or (b) unable to satisfy customer delivery requirements of ~192MMbtu in a 12-month period, 15 cargoes over 90 days or 50 cargoes in a 12-month period. In the case of force majeure, the customers are required to pay their capacity reservation fees for the initial 18 months. **Ratings may be changed, suspended or withdrawn at anytime and are not a recommendation to buy, hold or sell any security. 69
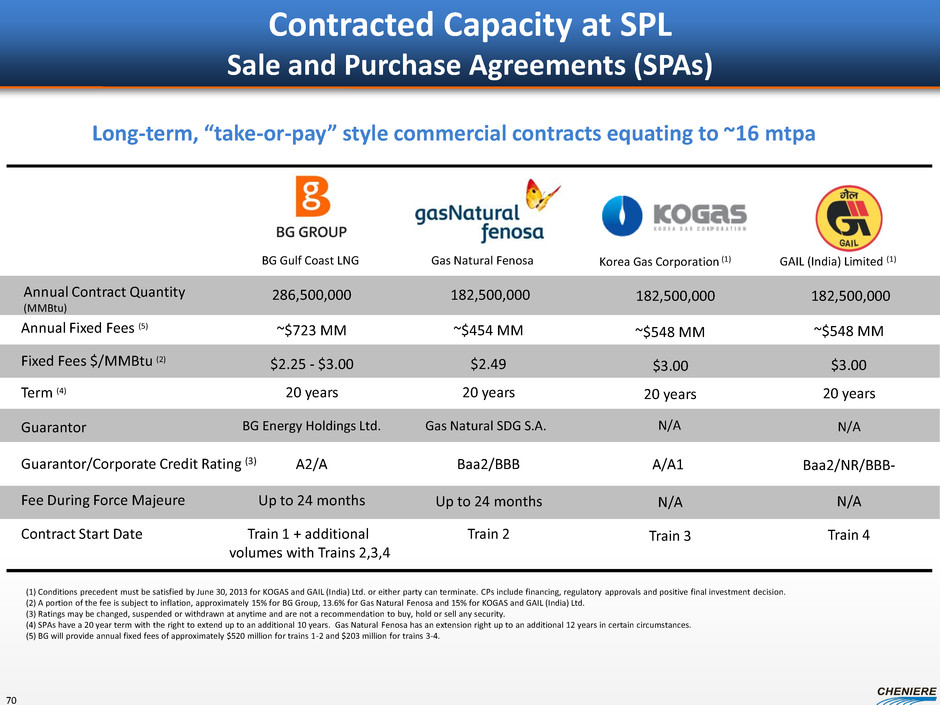
Contracted Capacity at SPL Sale and Purchase Agreements (SPAs) (1) Conditions precedent must be satisfied by June 30, 2013 for KOGAS and GAIL (India) Ltd. or either party can terminate. CPs include financing, regulatory approvals and positive final investment decision. (2) A portion of the fee is subject to inflation, approximately 15% for BG Group, 13.6% for Gas Natural Fenosa and 15% for KOGAS and GAIL (India) Ltd. (3) Ratings may be changed, suspended or withdrawn at anytime and are not a recommendation to buy, hold or sell any security. (4) SPAs have a 20 year term with the right to extend up to an additional 10 years. Gas Natural Fenosa has an extension right up to an additional 12 years in certain circumstances. (5) BG will provide annual fixed fees of approximately $520 million for trains 1-2 and $203 million for trains 3-4. BG Gulf Coast LNG Gas Natural Fenosa Annual Contract Quantity (MMBtu) 286,500,000 Fixed Fees $/MMBtu (2) Annual Fixed Fees (5) ~$723 MM ~$454 MM Term (4) Guarantor 20 years BG Energy Holdings Ltd. Gas Natural SDG S.A. Guarantor/Corporate Credit Rating (3) A2/A Baa2/BBB Fee During Force Majeure Up to 24 months Up to 24 months 20 years GAIL (India) Limited (1) ~$548 MM 20 years Baa2/NR/BBB- N/A Long-term, “take-or-pay” style commercial contracts equating to ~16 mtpa N/A Contract Start Date Train 1 + additional volumes with Trains 2,3,4 Train 2 Train 4 $2.25 - $3.00 $2.49 $3.00 182,500,000 182,500,000 20 years N/A N/A A/A1 Train 3 $3.00 ~$548 MM Korea Gas Corporation (1) 182,500,000 70
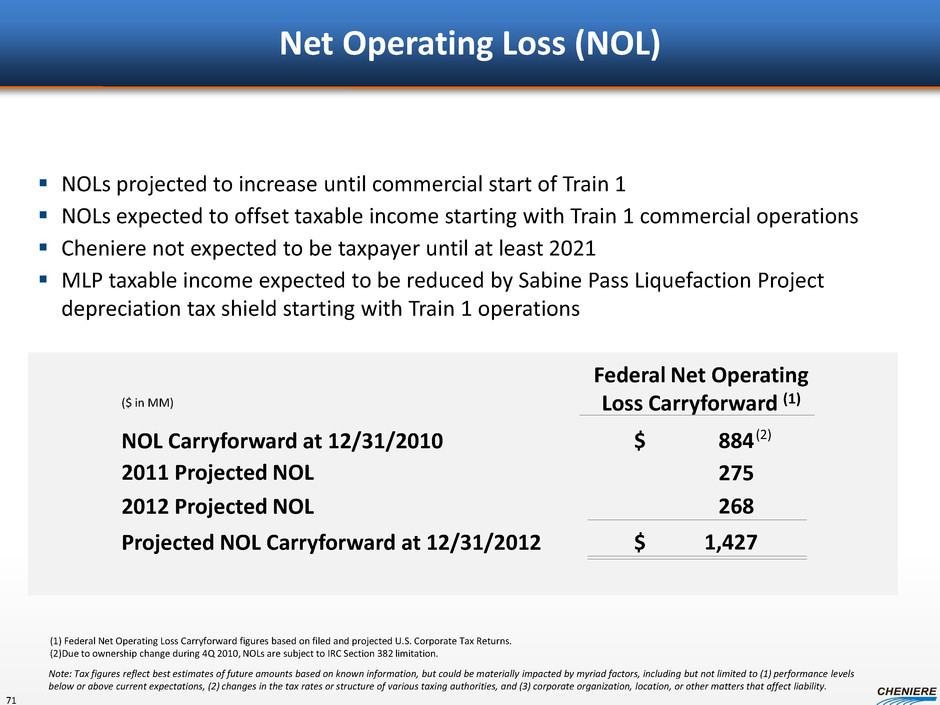
NOLs projected to increase until commercial start of Train 1 NOLs expected to offset taxable income starting with Train 1 commercial operations Cheniere not expected to be taxpayer until at least 2021 MLP taxable income expected to be reduced by Sabine Pass Liquefaction Project depreciation tax shield starting with Train 1 operations Net Operating Loss (NOL) Federal Net Operating Loss Carryforward (1) NOL Carryforward at 12/31/2010 884 $ 2011 Projected NOL 275 Projected NOL Carryforward at 12/31/2012 $ 2012 Projected NOL ($ in MM) 268 1,427 (1) Federal Net Operating Loss Carryforward figures based on filed and projected U.S. Corporate Tax Returns. (2)Due to ownership change during 4Q 2010, NOLs are subject to IRC Section 382 limitation. (2) Note: Tax figures reflect best estimates of future amounts based on known information, but could be materially impacted by myriad factors, including but not limited to (1) performance levels below or above current expectations, (2) changes in the tax rates or structure of various taxing authorities, and (3) corporate organization, location, or other matters that affect liability. 71
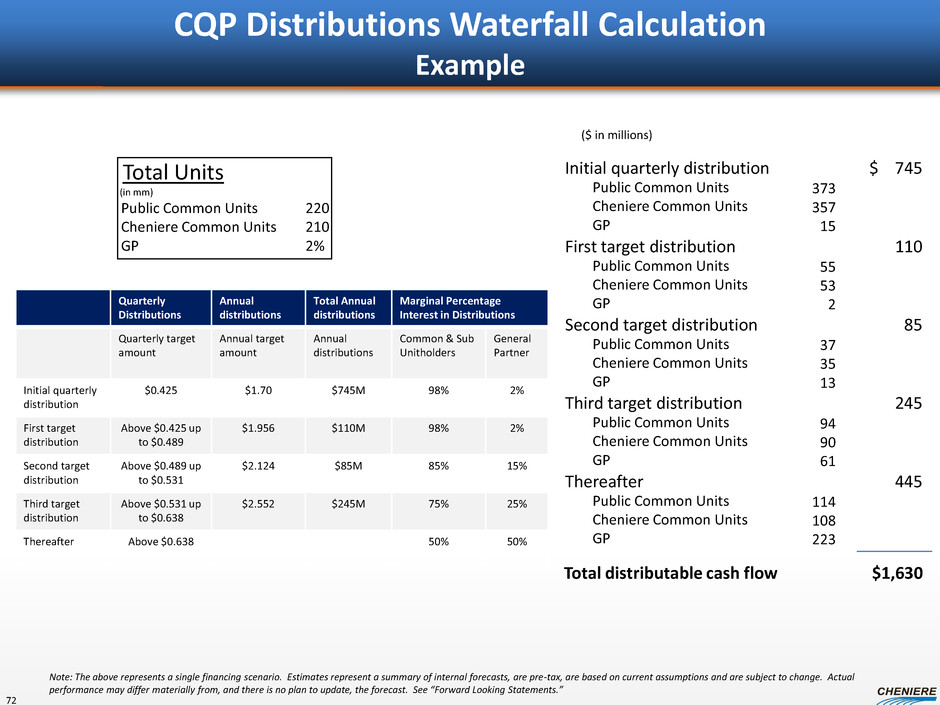
CQP Distributions Waterfall Calculation Example Quarterly Distributions Annual distributions Total Annual distributions Marginal Percentage Interest in Distributions Quarterly target amount Annual target amount Annual distributions Common & Sub Unitholders General Partner Initial quarterly distribution $0.425 $1.70 $745M 98% 2% First target distribution Above $0.425 up to $0.489 $1.956 $110M 98% 2% Second target distribution Above $0.489 up to $0.531 $2.124 $85M 85% 15% Third target distribution Above $0.531 up to $0.638 $2.552 $245M 75% 25% Thereafter Above $0.638 50% 50% Total distributable cash flow $1,630 Initial quarterly distribution First target distribution Second target distribution Third target distribution Thereafter $ 745 110 85 245 445 Total Units (in mm) Public Common Units 220 Cheniere Common Units 210 GP 2% Public Common Units Cheniere Common Units GP Public Common Units Cheniere Common Units GP Public Common Units Cheniere Common Units GP Public Common Units Cheniere Common Units GP Public Common Units Cheniere Common Units GP 373 357 15 55 53 2 37 35 13 94 90 61 114 108 223 Note: The above represents a single financing scenario. Estimates represent a summary of internal forecasts, are pre-tax, are based on current assumptions and are subject to change. Actual performance may differ materially from, and there is no plan to update, the forecast. See “Forward Looking Statements.” ($ in millions) 72
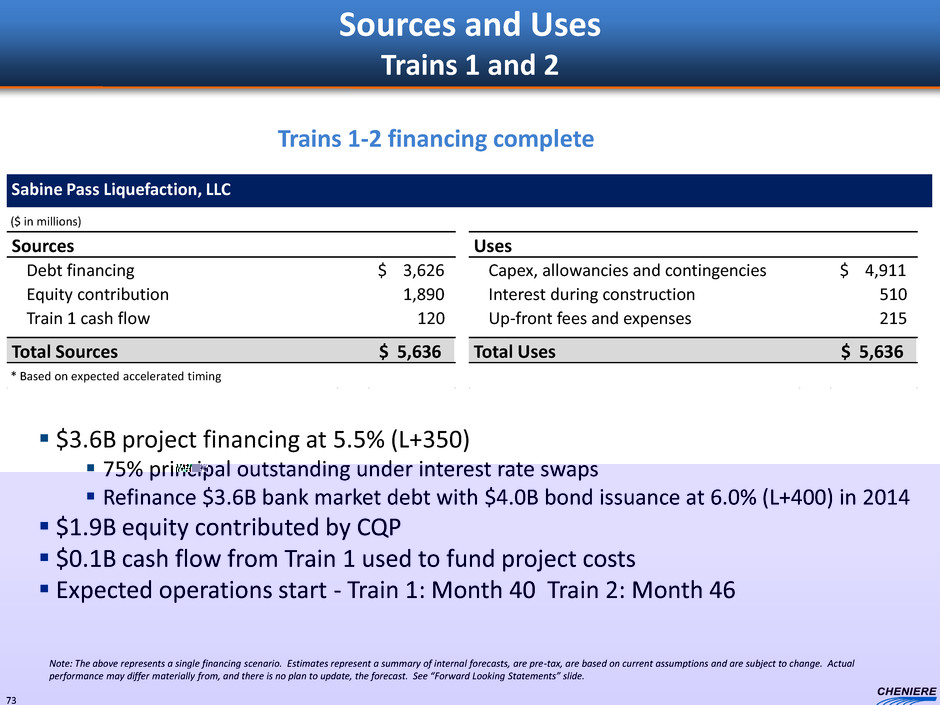
Sabine Pass Liquefaction, LLC Trains 1-2 financing complete Sources and Uses Trains 1 and 2 $3.6B project financing at 5.5% (L+350) 75% principal outstanding under interest rate swaps Refinance $3.6B bank market debt with $4.0B bond issuance at 6.0% (L+400) in 2014 $1.9B equity contributed by CQP $0.1B cash flow from Train 1 used to fund project costs Expected operations start - Train 1: Month 40 Train 2: Month 46 Sources Uses Debt financing 3,626 $ Capex, allowancies and contingencies 4,911 $ Equity contribution 1,890 Interest during construction 510 Train 1 cash flow 120 Up-front fees and expenses 215 Total Sources 5,636 $ Total Uses 5,636 $ * Based on expected accelerated timing ($ in millions) Note: The above represents a single financing scenario. Estimates represent a summary of internal forecasts, are pre-tax, are based on current assumptions and are subject to change. Actual performance may differ materially from, and there is no plan to update, the forecast. See “Forward Looking Statements” slide. 73
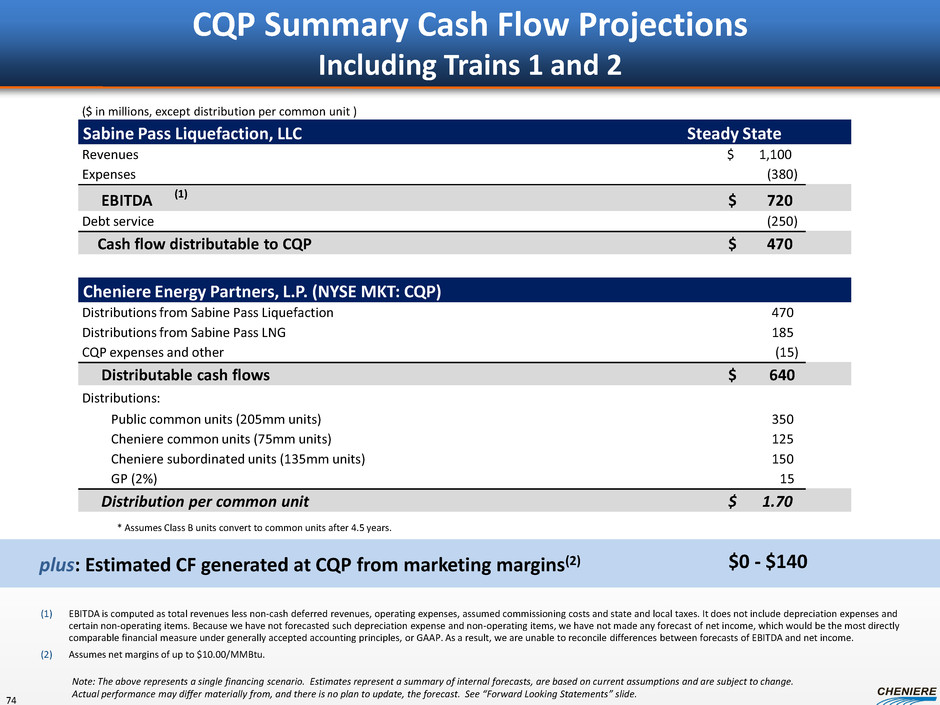
CQP Summary Cash Flow Projections Including Trains 1 and 2 Note: The above represents a single financing scenario. Estimates represent a summary of internal forecasts, are based on current assumptions and are subject to change. Actual performance may differ materially from, and there is no plan to update, the forecast. See “Forward Looking Statements” slide. (1) EBITDA is computed as total revenues less non-cash deferred revenues, operating expenses, assumed commissioning costs and state and local taxes. It does not include depreciation expenses and certain non-operating items. Because we have not forecasted such depreciation expense and non-operating items, we have not made any forecast of net income, which would be the most directly comparable financial measure under generally accepted accounting principles, or GAAP. As a result, we are unable to reconcile differences between forecasts of EBITDA and net income. (2) Assumes net margins of up to $10.00/MMBtu. plus: Estimated CF generated at CQP from marketing margins(2) $0 - $140 ($ in millions, except distribution per common unit ) Sabine Pass Liquefaction, LLC Steady State Revenues 1,100 $ Expenses (380) EBITDA (1) 720 $ Debt service (250) Cash flow distributable to CQP 470 $ Cheniere Energy Partners, L.P. (NYSE MKT: CQP) Distributions from Sabine Pass Liquefaction 470 Distributions from Sabine Pass LNG 185 CQP expenses and other (15) Distributable cash flows 640 $ Distributions: Public common units (205mm units) 350 Cheniere common units (75mm units) 125 Cheniere subordinated units (135mm units) 150 GP (2%) 15 Distribution per common unit 1.70 $ * Assumes Class B units convert to common units after 4.5 years. 74
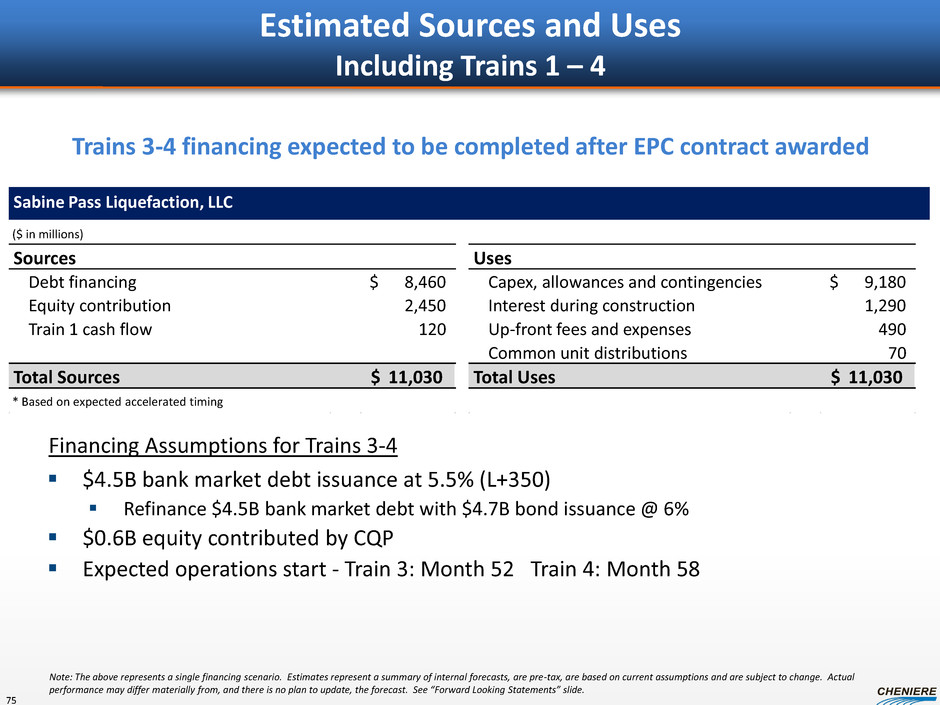
Estimated Sources and Uses Including Trains 1 – 4 Sabine Pass Liquefaction, LLC $4.5B bank market debt issuance at 5.5% (L+350) Refinance $4.5B bank market debt with $4.7B bond issuance @ 6% $0.6B equity contributed by CQP Expected operations start - Train 3: Month 52 Train 4: Month 58 Financing Assumptions for Trains 3-4 Trains 3-4 financing expected to be completed after EPC contract awarded Sources Uses Debt financing 8,460 $ Capex, allowances and contingencies 9,180 $ Equity contribution 2,450 Interest during construction 1,290 Train 1 cash flow 120 Up-front fees and expenses 490 Common unit distributions 70 Total Sources 11,030 $ Total Uses 11,030 $ * Based on expected accelerated timing ($ in millions) Note: The above represents a single financing scenario. Estimates represent a summary of internal forecasts, are pre-tax, are based on current assumptions and are subject to change. Actual performance may differ materially from, and there is no plan to update, the forecast. See “Forward Looking Statements” slide. 75
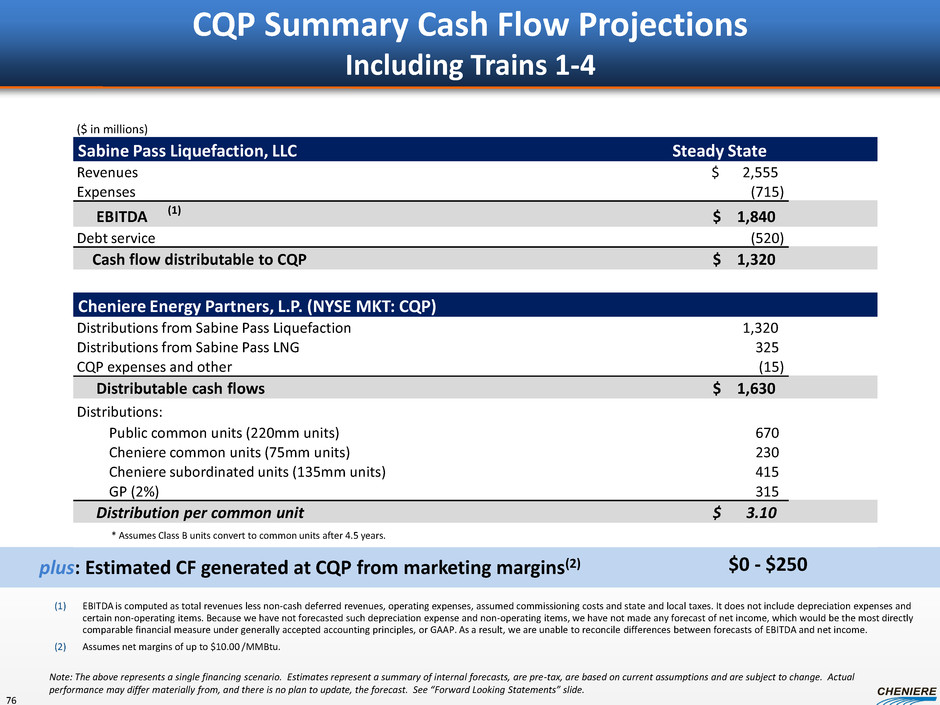
CQP Summary Cash Flow Projections Including Trains 1-4 (1) EBITDA is computed as total revenues less non-cash deferred revenues, operating expenses, assumed commissioning costs and state and local taxes. It does not include depreciation expenses and certain non-operating items. Because we have not forecasted such depreciation expense and non-operating items, we have not made any forecast of net income, which would be the most directly comparable financial measure under generally accepted accounting principles, or GAAP. As a result, we are unable to reconcile differences between forecasts of EBITDA and net income. (2) Assumes net margins of up to $10.00 /MMBtu. plus: Estimated CF generated at CQP from marketing margins(2) $0 - $250 ($ in millions) Sabine Pass Liquefaction, LLC Steady State Revenues 2,555 $ Expenses (715) EBITDA (1) 1,840 $ Debt service (520) Cash flow distributable to CQP 1,320 $ Cheniere Energy Partners, L.P. (NYSE MKT: CQP) Distributions from Sabine Pass Liquefaction 1,320 Distributions from Sabine Pass LNG 325 CQP expenses and other (15) Distributable cash flows 1,630 $ Distributions: Public common units (220mm units) 670 Cheniere common units (75mm units) 230 Cheniere subordinated units (135mm units) 415 GP (2%) 315 Distribution per common unit 3.10 $ * Assumes Class B units convert to common units after 4.5 years. Note: The above represents a single financing scenario. Estimates represent a summary of internal forecasts, are pre-tax, are based on current assumptions and are subject to change. Actual performance may differ materially from, and there is no plan to update, the forecast. See “Forward Looking Statements” slide. 76
2012 Investor/Analyst Day Conference September 2012