1
CHENIERE ENERGY PARTNERS, L.P.
CORPORATE PRESENTATION | March 2018
NYSE American: CQP
2
Safe Harbor Statements
Forward-Looking Statements
This presentation contains certain statements that are, or may be deemed to be, “forward-looking statements.” All statements, other than statements of historical or present facts or conditions, included or
incorporated by reference herein are “forward-looking statements.” Included among “forward-looking statements” are, among other things:
• statements regarding the ability of Cheniere Energy Partners, L.P. to pay distributions to its unitholders;
• statements regarding Cheniere Energy Partners, L.P.’s expected receipt of cash distributions from its respective subsidiaries;
• statements that Cheniere Energy Partners, L.P. expects to commence or complete construction of its proposed liquefied natural gas (“LNG”) terminals, liquefaction facilities, pipeline facilities or
other projects, or any expansions or portions thereof, by certain dates or at all;
• statements regarding future levels of domestic and international natural gas production, supply or consumption or future levels of LNG imports into or exports from North America and other
countries worldwide, or purchases of natural gas, regardless of the source of such information, or the transportation or other infrastructure, or demand for and prices related to natural gas, LNG or
other hydrocarbon products;
• statements regarding any financing transactions or arrangements, or ability to enter into such transactions;
• statements regarding any agreement to be entered into or performed substantially in the future, including any revenues anticipated to be received and the anticipated timing thereof, and statements
regarding the amounts of total LNG regasification, natural gas, liquefaction or storage capacities that are, or may become, subject to contracts;
• statements regarding counterparties to our and our subsidiaries’ commercial contracts, construction contracts and other contracts;
• statements regarding our planned development and construction of additional Trains or pipelines, including the financing of such Trains or pipelines;
• statements that our Trains, when completed, will have certain characteristics, including amounts of liquefaction capacities;
• statements regarding our business strategy, our strengths, our business and operation plans or any other plans, forecasts, projections or objectives, including anticipated revenues, expenses,
capital expenditures, maintenance and operating costs, run-rate SG&A estimates, cash flows, EBITDA, Adjusted EBITDA, run-rate EBITDA, distributable cash flow, and distributable cash flow per
unit, any or all of which are subject to change;
• statements regarding any independent engineers’ and independent market consultants’ assumptions, estimates, projections or conclusions;
• statements regarding projections of revenues, expenses, earnings or losses, working capital or other financial items;
• statements regarding legislative, governmental, regulatory, administrative or other public body actions, approvals, requirements, permits, applications, filings, investigations, proceedings or
decisions;
• statements regarding our anticipated LNG and natural gas marketing activities; and
• any other statements that relate to non-historical or future information.
These forward-looking statements are often identified by the use of terms and phrases such as “achieve,” “anticipate,” “believe,” “contemplate,” “develop,” “estimate,” “example,” “expect,” “forecast,” “goals,”
”guidance,” “opportunities,” “plan,” “potential,” “project,” “propose,” “subject to,” “strategy,” “target,” and similar terms and phrases, or by use of future tense. Although we believe that the expectations reflected
in these forward-looking statements are reasonable, they do involve assumptions, risks and uncertainties, and these expectations may prove to be incorrect. You should not place undue reliance on these
forward-looking statements, which speak only as of the date of this presentation. Our actual results could differ materially from those anticipated in these forward-looking statements as a result of a variety of
factors, including those discussed in “Risk Factors” in the Cheniere Energy Partners, L.P. Annual Report on Form 10-K filed with the SEC on February 21, 2018, which is incorporated by reference into this
presentation. All forward-looking statements attributable to us or persons acting on our behalf are expressly qualified in their entirety by these ”Risk Factors.” These forward-looking statements are made as of
the date of this presentation, and other than as required by law, we undertake no obligation to update or revise any forward-looking statement or provide reasons why actual results may differ, whether as a
result of new information, future events or otherwise.
Reconciliation to U.S. GAAP Financial Information
The following presentation includes certain “non-GAAP financial measures” as defined in Regulation G under the Securities Exchange Act of 1934, as amended. Schedules are included in the appendix hereto
that reconcile the non-GAAP financial measures included in the following presentation to the most directly comparable financial measures calculated and presented in accordance with U.S. GAAP.
3
CHENIERE PARTNERS OVERVIEW
4
Cheniere Partners (CQP) Investment Thesis
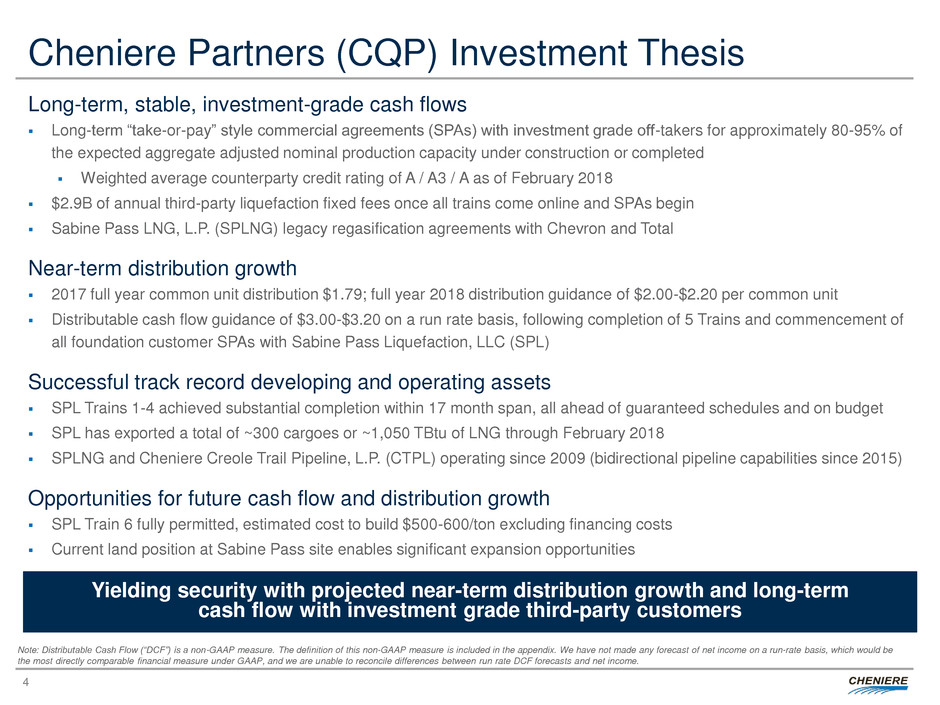
Long-term, stable, investment-grade cash flows
Long-term “take-or-pay” style commercial agreements (SPAs) with investment grade off-takers for approximately 80-95% of
the expected aggregate adjusted nominal production capacity under construction or completed
Weighted average counterparty credit rating of A / A3 / A as of February 2018
$2.9B of annual third-party liquefaction fixed fees once all trains come online and SPAs begin
Sabine Pass LNG, L.P. (SPLNG) legacy regasification agreements with Chevron and Total
Near-term distribution growth
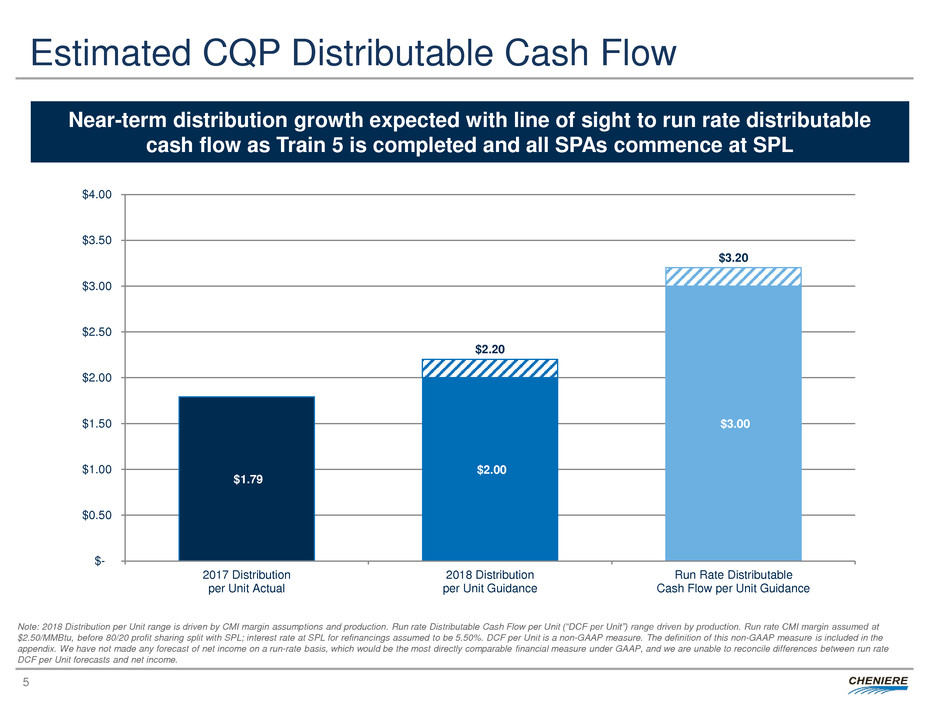
2017 full year common unit distribution $1.79; full year 2018 distribution guidance of $2.00-$2.20 per common unit
Distributable cash flow guidance of $3.00-$3.20 on a run rate basis, following completion of 5 Trains and commencement of
all foundation customer SPAs with Sabine Pass Liquefaction, LLC (SPL)
Successful track record developing and operating assets
SPL Trains 1-4 achieved substantial completion within 17 month span, all ahead of guaranteed schedules and on budget
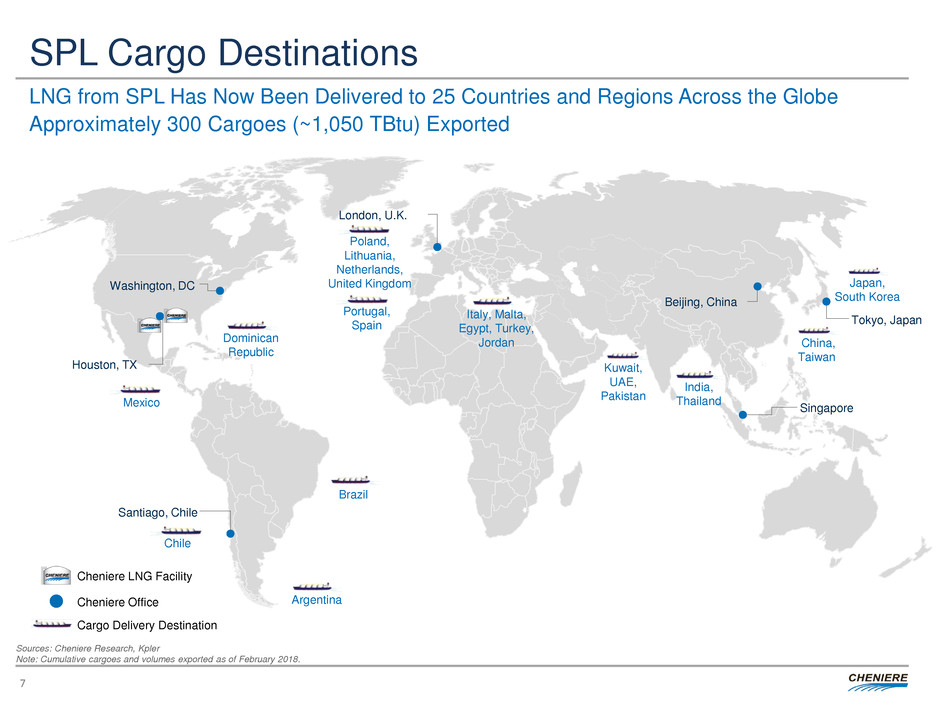
SPL has exported a total of ~300 cargoes or ~1,050 TBtu of LNG through February 2018
SPLNG and Cheniere Creole Trail Pipeline, L.P. (CTPL) operating since 2009 (bidirectional pipeline capabilities since 2015)
Opportunities for future cash flow and distribution growth
SPL Train 6 fully permitted, estimated cost to build $500-600/ton excluding financing costs
Current land position at Sabine Pass site enables significant expansion opportunities
Yielding security with projected near-term distribution growth and long-term
cash flow with investment grade third-party customers
Note: Distributable Cash Flow (“DCF”) is a non-GAAP measure. The definition of this non-GAAP measure is included in the appendix. We have not made any forecast of net income on a run-rate basis, which would be
the most directly comparable financial measure under GAAP, and we are unable to reconcile differences between run rate DCF forecasts and net income.
5
Note: 2018 Distribution per Unit range is driven by CMI margin assumptions and production. Run rate Distributable Cash Flow per Unit (“DCF per Unit”) range driven by production. Run rate CMI margin assumed at
$2.50/MMBtu, before 80/20 profit sharing split with SPL; interest rate at SPL for refinancings assumed to be 5.50%. DCF per Unit is a non-GAAP measure. The definition of this non-GAAP measure is included in the
appendix. We have not made any forecast of net income on a run-rate basis, which would be the most directly comparable financial measure under GAAP, and we are unable to reconcile differences between run rate
DCF per Unit forecasts and net income.
Near-term distribution growth expected with line of sight to run rate distributable
cash flow as Train 5 is completed and all SPAs commence at SPL
$1.79
$2.00
$3.00
$2.20
$3.20
$-
$0.50
$1.00
$1.50
$2.00
$2.50
$3.00
$3.50
$4.00
2017 Distribution
per Unit Actual
2018 Distribution
per Unit Guidance
Run Rate Distributable
Cash Flow per Unit Guidance
Estimated CQP Distributable Cash Flow
6
Integrated and Complementary CQP Asset Platform
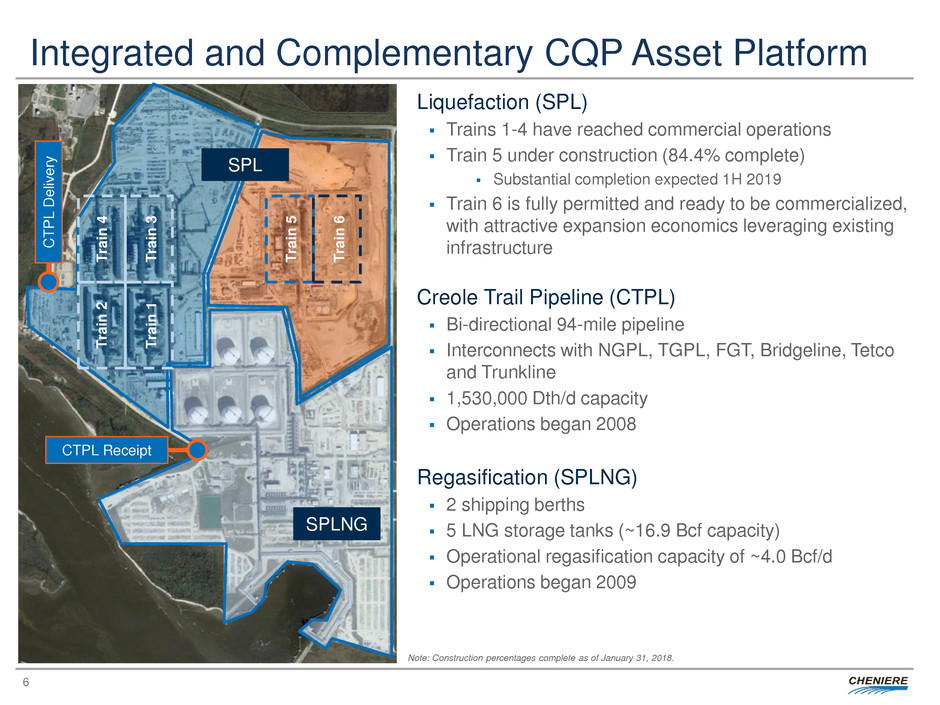
Liquefaction (SPL)
Trains 1-4 have reached commercial operations
Train 5 under construction (84.4% complete)
Substantial completion expected 1H 2019
Train 6 is fully permitted and ready to be commercialized,
with attractive expansion economics leveraging existing
infrastructure
Creole Trail Pipeline (CTPL)
Bi-directional 94-mile pipeline
Interconnects with NGPL, TGPL, FGT, Bridgeline, Tetco
and Trunkline
1,530,000 Dth/d capacity
Operations began 2008
Regasification (SPLNG)
2 shipping berths
5 LNG storage tanks (~16.9 Bcf capacity)
Operational regasification capacity of ~4.0 Bcf/d
Operations began 2009
T
ra
in
4
T
ra
in
3
T
ra
in
2
T
ra
in
1
T
ra
in
5
T
ra
in
6
SPLNG
SPL
CTPL Receipt
C
T
P
L
D
e
liv
er
y
Note: Construction percentages complete as of January 31, 2018.
SPL Cargo Destinations
LNG from SPL Has Now Been Delivered to 25 Countries and Regions Across the Globe
Approximately 300 Cargoes (~1,050 TBtu) Exported
Sources: Cheniere Research, Kpler
Note: Cumulative cargoes and volumes exported as of February 2018.
7
Santiago, Chile
Cheniere Office
Cheniere LNG Facility
Portugal,
Spain
Kuwait,
UAE,
Pakistan
India,
Thailand
Brazil
Argentina
Houston, TX
Washington, DC
London, U.K.
Singapore
Cargo Delivery Destination
China,
Taiwan
Poland,
Lithuania,
Netherlands,
United Kingdom
Mexico
Dominican
Republic
Italy, Malta,
Egypt, Turkey,
Jordan
Japan,
South Korea
Chile
Tokyo, Japan
Beijing, China
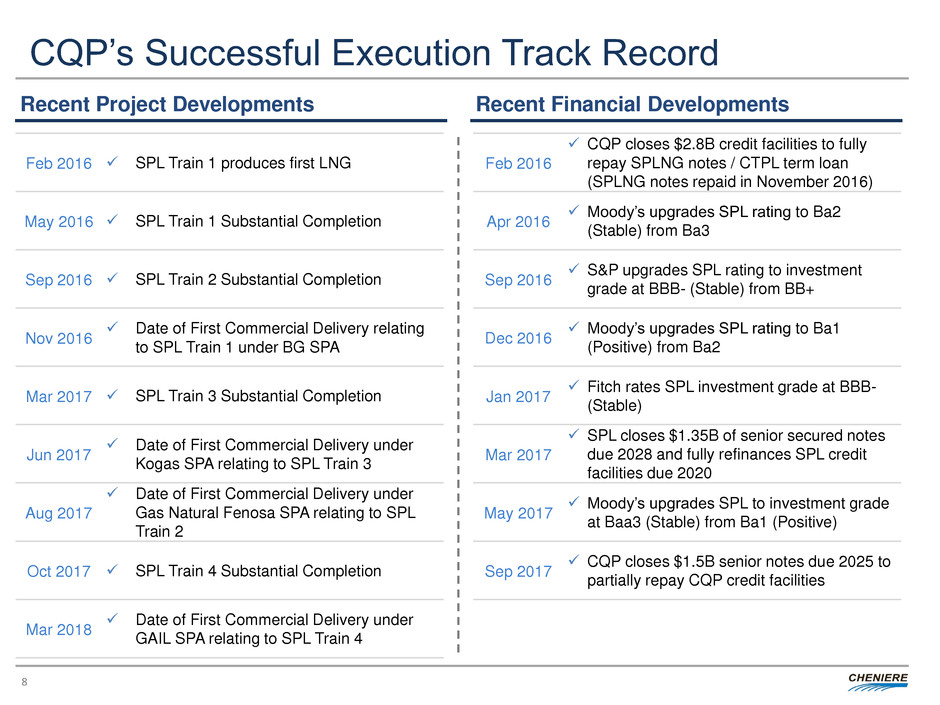
CQP’s Successful Execution Track Record
8
Feb 2016 SPL Train 1 produces first LNG
May 2016 SPL Train 1 Substantial Completion
Sep 2016 SPL Train 2 Substantial Completion
Nov 2016
Date of First Commercial Delivery relating
to SPL Train 1 under BG SPA
Mar 2017 SPL Train 3 Substantial Completion
Jun 2017
Date of First Commercial Delivery under
Kogas SPA relating to SPL Train 3
Aug 2017
Date of First Commercial Delivery under
Gas Natural Fenosa SPA relating to SPL
Train 2
Oct 2017 SPL Train 4 Substantial Completion
Mar 2018
Date of First Commercial Delivery under
GAIL SPA relating to SPL Train 4
Feb 2016
CQP closes $2.8B credit facilities to fully
repay SPLNG notes / CTPL term loan
(SPLNG notes repaid in November 2016)
Apr 2016
Moody’s upgrades SPL rating to Ba2
(Stable) from Ba3
Sep 2016
S&P upgrades SPL rating to investment
grade at BBB- (Stable) from BB+
Dec 2016
Moody’s upgrades SPL rating to Ba1
(Positive) from Ba2
Jan 2017
Fitch rates SPL investment grade at BBB-
(Stable)
Mar 2017
SPL closes $1.35B of senior secured notes
due 2028 and fully refinances SPL credit
facilities due 2020
May 2017
Moody’s upgrades SPL to investment grade
at Baa3 (Stable) from Ba1 (Positive)
Sep 2017
CQP closes $1.5B senior notes due 2025 to
partially repay CQP credit facilities
Recent Financial Developments Recent Project Developments
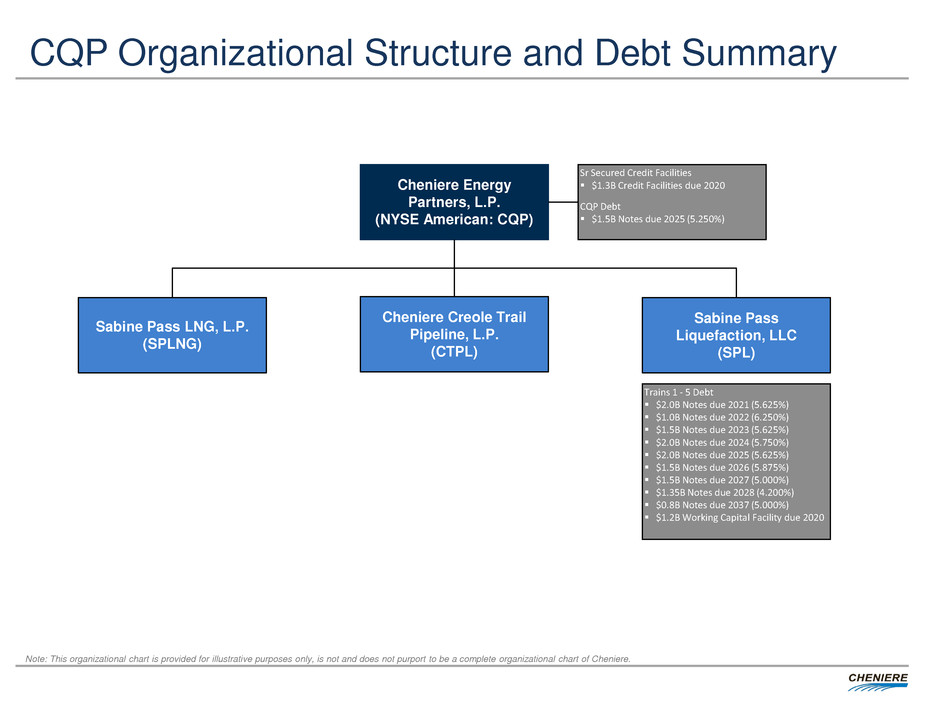
CQP Organizational Structure and Debt Summary
Cheniere Energy
Partners, L.P.
(NYSE American: CQP)
Sabine Pass LNG, L.P.
(SPLNG)
Sabine Pass
Liquefaction, LLC
(SPL)
Cheniere Creole Trail
Pipeline, L.P.
(CTPL)
Note: This organizational chart is provided for illustrative purposes only, is not and does not purport to be a complete organizational chart of Cheniere.
Sr Secured Credit Facilities
$1.3B Credit Facilities due 2020
CQP Debt
$1.5B Notes due 2025 (5.250%)
Trains 1 - 5 Debt
$2.0B Notes due 2021 (5.625%)
$1.0B Notes due 2022 (6.250%)
$1.5B Notes due 2023 (5.625%)
$2.0B Notes due 2024 (5.750%)
$2.0B Notes due 2025 (5.625%)
$1.5B Notes due 2026 (5.875%)
$1.5B Notes due 2027 (5.000%)
$1.35B Notes due 2028 (4.200%)
$0.8B Notes due 2037 (5.000%)
$1.2B Working Capital Facility due 2020
10
BUSINESS UPDATE
11
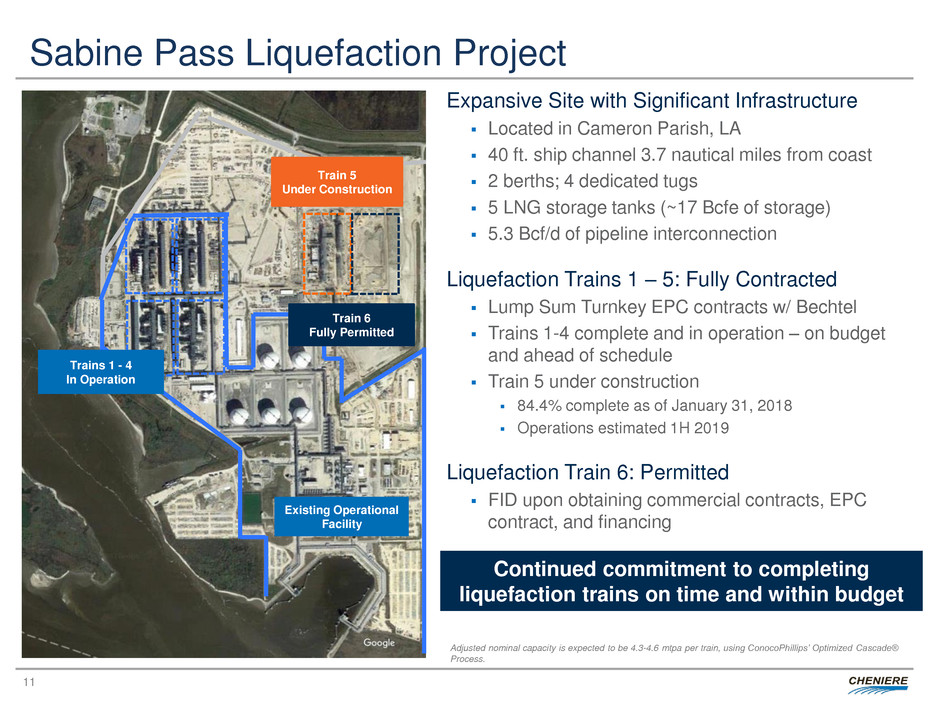
Sabine Pass Liquefaction Project
Expansive Site with Significant Infrastructure
Located in Cameron Parish, LA
40 ft. ship channel 3.7 nautical miles from coast
2 berths; 4 dedicated tugs
5 LNG storage tanks (~17 Bcfe of storage)
5.3 Bcf/d of pipeline interconnection
Liquefaction Trains 1 – 5: Fully Contracted
Lump Sum Turnkey EPC contracts w/ Bechtel
Trains 1-4 complete and in operation – on budget
and ahead of schedule
Train 5 under construction
84.4% complete as of January 31, 2018
Operations estimated 1H 2019
Liquefaction Train 6: Permitted
FID upon obtaining commercial contracts, EPC
contract, and financing
Continued commitment to completing
liquefaction trains on time and within budget
Train 6
Fully Permitted
Existing Operational
Facility
Train 5
Under Construction
Trains 1 - 4
In Operation
Adjusted nominal capacity is expected to be 4.3-4.6 mtpa per train, using ConocoPhillips’ Optimized Cascade®
Process.
12
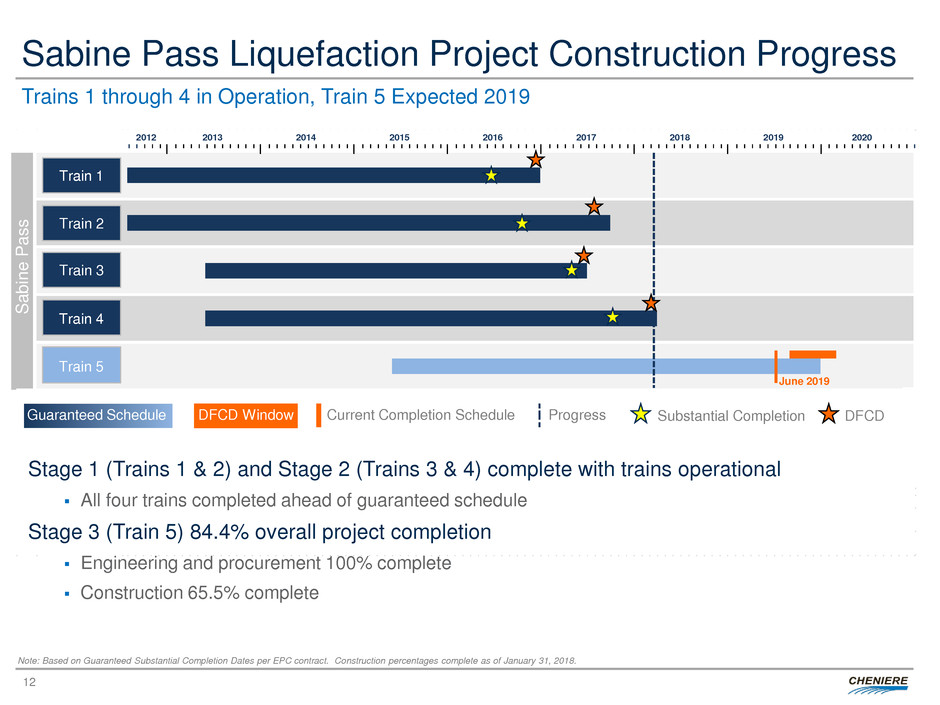
Sabine Pass Liquefaction Project Construction Progress
Trains 1 through 4 in Operation, Train 5 Expected 2019
Note: Based on Guaranteed Substantial Completion Dates per EPC contract. Construction percentages complete as of January 31, 2018.
DFCD Window Current Completion Schedule Progress Guaranteed Schedule
Sabine
Pas
s
2020
June 2019
2018 2019 2012 2013 2014 2015 2016 2017
Train 1
Train 2
Train 3
Train 4
Train 5
Substantial Completion DFCD
Stage 1 (Trains 1 & 2) and Stage 2 (Trains 3 & 4) complete with trains operational
All four trains completed ahead of guaranteed schedule
Stage 3 (Train 5) 84.4% overall project completion
Engineering and procurement 100% complete
Construction 65.5% complete
13
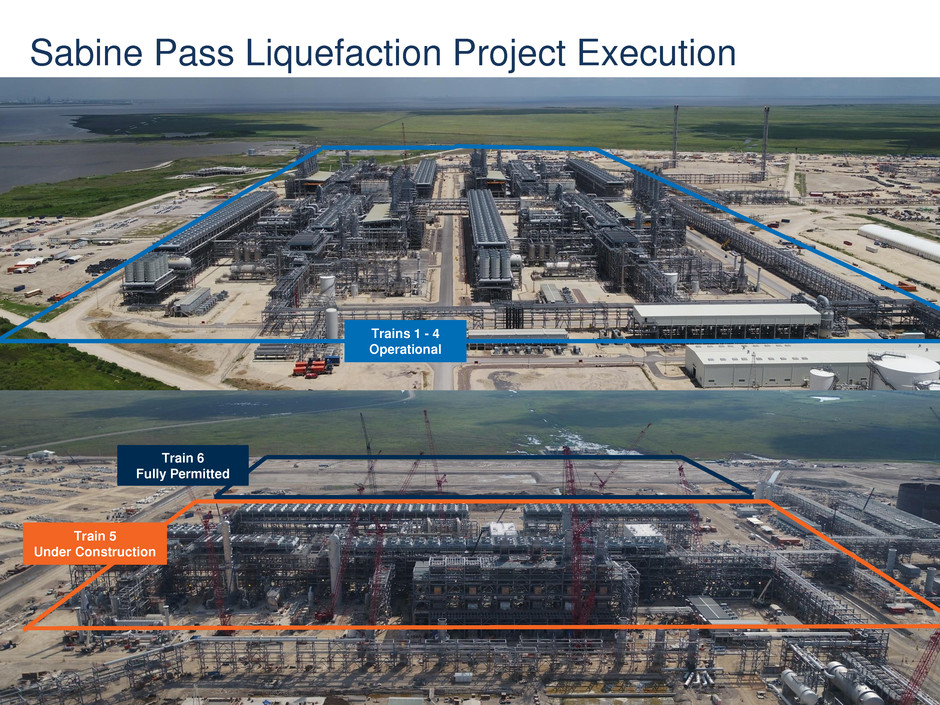
Sabine Pass Liquefaction Project Execution
1
3
Trains 1 - 4
Operational
Train 6
Fully Permitted
Train 5
Under Construction
14
LNG Operations
Transition Trains from construction to operations management safely, efficiently, and effectively
Identify and incorporate lessons learned
Cross-functional team working to identify lessons learned
Implement improvements and optimize processes across trains and locations
Build operational best practices to increase LNG production reliability and efficiency
Identify bottlenecks and areas of opportunity to maintain maximum performance
Execute on efficiencies to maximize production
Develop longer-term capital investment strategy to alleviate bottlenecks
Adjusted nominal capacity expected to range between 4.3 and 4.6 mtpa per train
Natural gas supply sourcing costs and facility use to date have averaged within allocated 115%
of Henry Hub variable liquefaction fee
15
Sabine Pass Facility
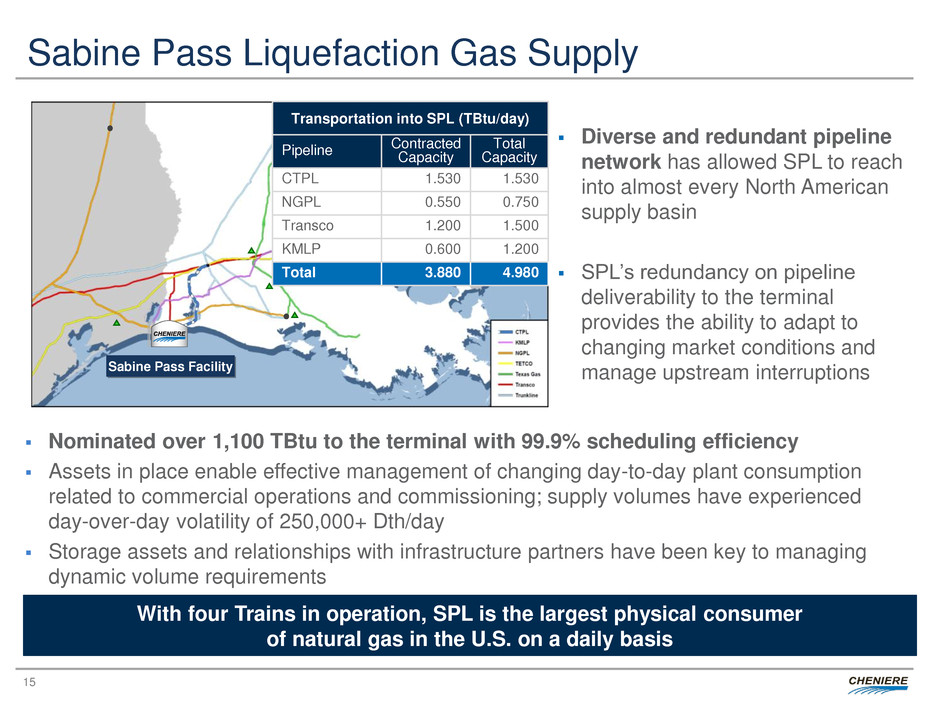
Sabine Pass Liquefaction Gas Supply
Transportation into SPL (TBtu/day)
Pipeline Contracted Capacity
Total
Capacity
CTPL 1.530 1.530
NGPL 0.550 0.750
Transco 1.200 1.500
KMLP 0.600 1.200
Total 3.880 4.980
Diverse and redundant pipeline
network has allowed SPL to reach
into almost every North American
supply basin
SPL’s redundancy on pipeline
deliverability to the terminal
provides the ability to adapt to
changing market conditions and
manage upstream interruptions
Nominated over 1,100 TBtu to the terminal with 99.9% scheduling efficiency
Assets in place enable effective management of changing day-to-day plant consumption
related to commercial operations and commissioning; supply volumes have experienced
day-over-day volatility of 250,000+ Dth/day
Storage assets and relationships with infrastructure partners have been key to managing
dynamic volume requirements
With four Trains in operation, SPL is the largest physical consumer
of natural gas in the U.S. on a daily basis
16
Sabine Pass LNG
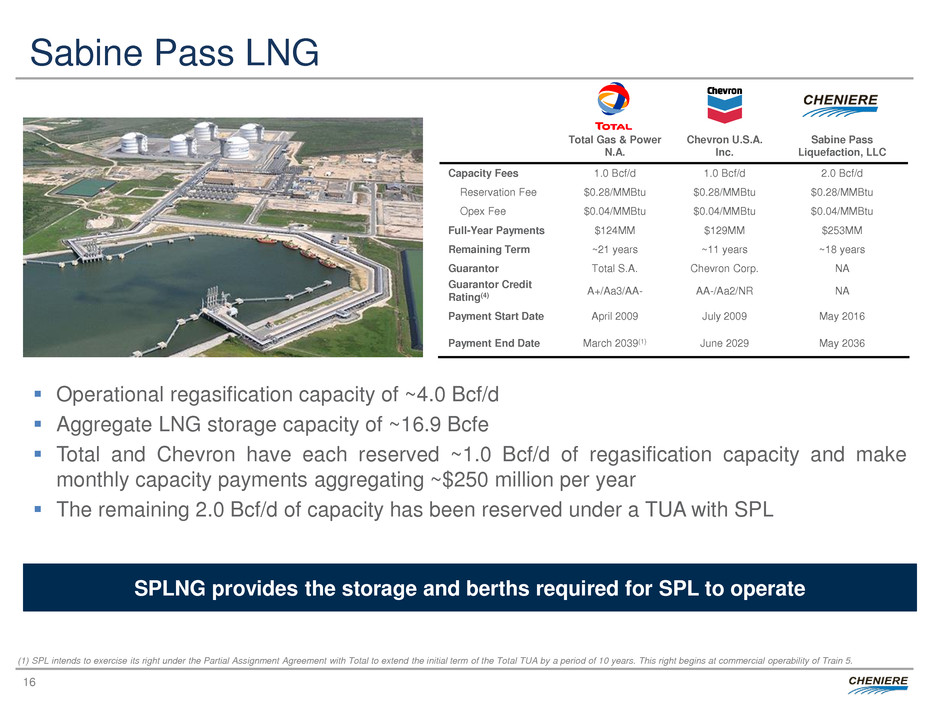
Operational regasification capacity of ~4.0 Bcf/d
Aggregate LNG storage capacity of ~16.9 Bcfe
Total and Chevron have each reserved ~1.0 Bcf/d of regasification capacity and make
monthly capacity payments aggregating ~$250 million per year
The remaining 2.0 Bcf/d of capacity has been reserved under a TUA with SPL
Total Gas & Power
N.A.
Chevron U.S.A.
Inc.
Sabine Pass
Liquefaction, LLC
Capacity Fees 1.0 Bcf/d 1.0 Bcf/d 2.0 Bcf/d
Reservation Fee $0.28/MMBtu $0.28/MMBtu $0.28/MMBtu
Opex Fee $0.04/MMBtu $0.04/MMBtu $0.04/MMBtu
Full-Year Payments $124MM $129MM $253MM
Remaining Term ~21 years ~11 years ~18 years
Guarantor Total S.A. Chevron Corp. NA
Guarantor Credit
Rating(4)
A+/Aa3/AA- AA-/Aa2/NR NA
Payment Start Date April 2009 July 2009 May 2016
Payment End Date March 2039(1) June 2029 May 2036
SPLNG provides the storage and berths required for SPL to operate
(1) SPL intends to exercise its right under the Partial Assignment Agreement with Total to extend the initial term of the Total TUA by a period of 10 years. This right begins at commercial operability of Train 5.
17
Creole Trail Pipeline
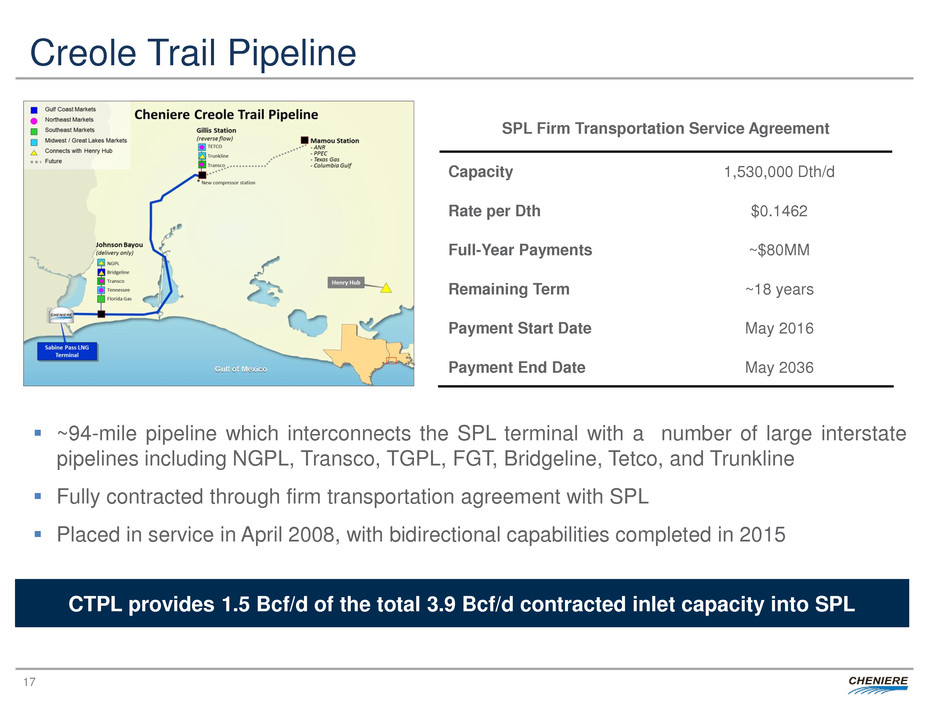
~94-mile pipeline which interconnects the SPL terminal with a number of large interstate
pipelines including NGPL, Transco, TGPL, FGT, Bridgeline, Tetco, and Trunkline
Fully contracted through firm transportation agreement with SPL
Placed in service in April 2008, with bidirectional capabilities completed in 2015
CTPL provides 1.5 Bcf/d of the total 3.9 Bcf/d contracted inlet capacity into SPL
SPL Firm Transportation Service Agreement
Capacity 1,530,000 Dth/d
Rate per Dth $0.1462
Full-Year Payments ~$80MM
Remaining Term ~18 years
Payment Start Date May 2016
Payment End Date May 2036
18
LNG MARKET OUTLOOK
19
Demand Growth Points to Approaching Supply Gap
Source: Cheniere Research, Kpler
(1) Includes Norway’s production
(4)
(2)
-
2
4
6
8
10
12
14
Ch
in
a
K
o
re
a
T
u
rk
e
y
S
p
a
in
Fr
a
n
c
e
P
a
k
is
ta
n
Ita
ly
P
o
rt
u
g
a
l
T
a
iwa
n
J
a
p
a
n
T
h
a
ila
n
d
M
e
x
ic
o
G
re
e
c
e
M
a
la
y
s
ia
P
o
la
n
d
S
in
g
a
p
o
re
T
h
e
N
e
th
e
rla
n
d
s
M
a
lta
In
d
ia
Is
ra
e
l
J
a
m
a
ic
a
Dom. R
e
p
u
b
lic
Ca
n
a
d
a
Br
a
z
il
Swe
d
e
n
F
in
la
n
d
J
o
rd
a
n
B
e
lg
iu
m
Norw
a
y
Co
lo
m
b
ia
Ch
ile
Ar
g
e
n
tin
a
L
ith
u
a
n
ia
U
S
K
u
wa
it
In
d
o
n
e
s
ia
P
u
e
rt
o
R
ic
o
UA
E
E
g
y
p
t
U
K
mtpa
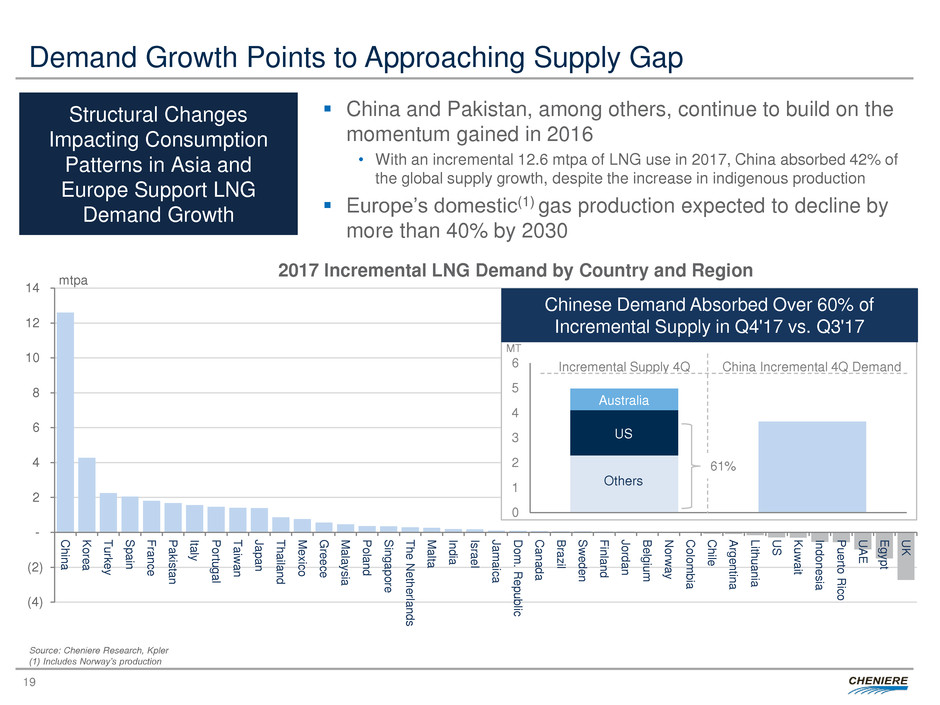
2017 Incremental LNG Demand by Country and Region
China and Pakistan, among others, continue to build on the
momentum gained in 2016
• With an incremental 12.6 mtpa of LNG use in 2017, China absorbed 42% of
the global supply growth, despite the increase in indigenous production
Europe’s domestic(1) gas production expected to decline by
more than 40% by 2030
Structural Changes
Impacting Consumption
Patterns in Asia and
Europe Support LNG
Demand Growth
0
1
2
3
4
5
6
MT
Australia
Incremental Supply 4Q
Chinese Demand Absorbed Over 60% of
Incremental Supply in Q4'17 vs. Q3'17
US
Others
China Incremental 4Q Demand
61%
20
Investment Slowdown to Pressure LNG Expansion
Source: Cheniere Research, Wood Mackenzie
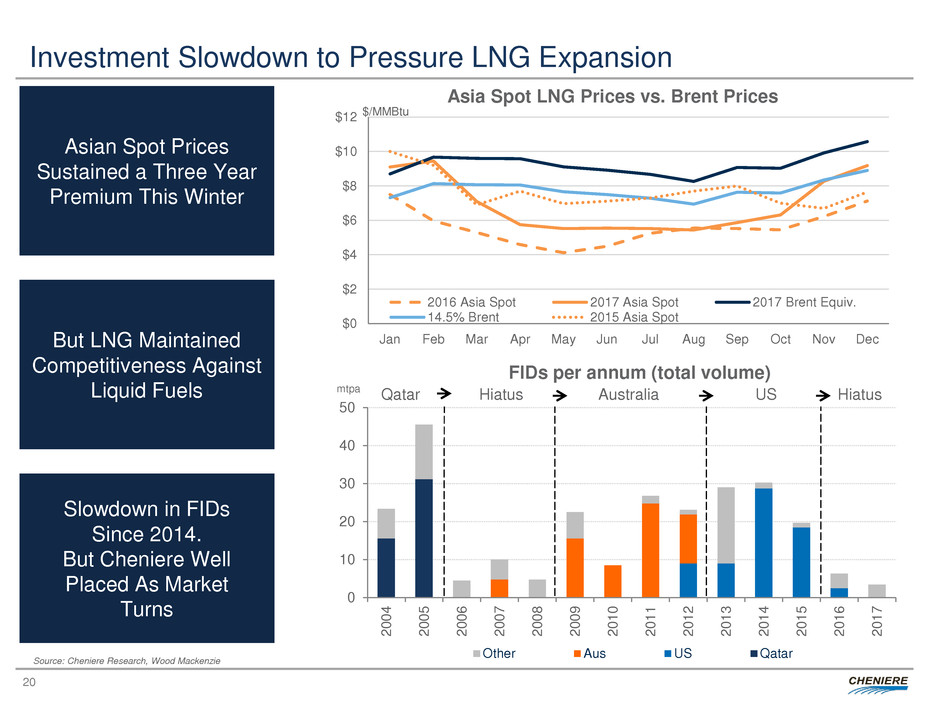
Asian Spot Prices
Sustained a Three Year
Premium This Winter
But LNG Maintained
Competitiveness Against
Liquid Fuels
Slowdown in FIDs
Since 2014.
But Cheniere Well
Placed As Market
Turns
$0
$2
$4
$6
$8
$10
$12
Jan Feb Mar Apr May Jun Jul Aug Sep Oct Nov Dec
$/MMBtu
Asia Spot LNG Prices vs. Brent Prices
2016 Asia Spot 2017 Asia Spot 2017 Brent
14.5% Brent 2015 Asia Spot
0
10
20
30
40
50
2
0
0
4
2
0
0
5
2
0
0
6
2
0
0
7
2
0
0
8
2
0
0
9
2
0
1
0
2
0
1
1
2
0
1
2
2
0
1
3
2
0
1
4
2
0
1
5
2
0
1
6
2
0
1
7
Other Aus US Qatar
FIDs per annum (total volume)
mtpa Qatar Hiatus Australia US Hiatus
$0
$2
$4
$6
$8
$10
$12
Jan Feb Mar Apr May Jun Jul Aug Sep Oct Nov Dec
$/MMBtu
Asia Spot LNG Prices vs. Brent Prices
2016 Asia Spot 2017 Asia Spot 2017 Brent Equiv.
14.5% Brent 2015 Asia Spot
21
STRATEGIC ADVANTAGES AND GROWTH
22
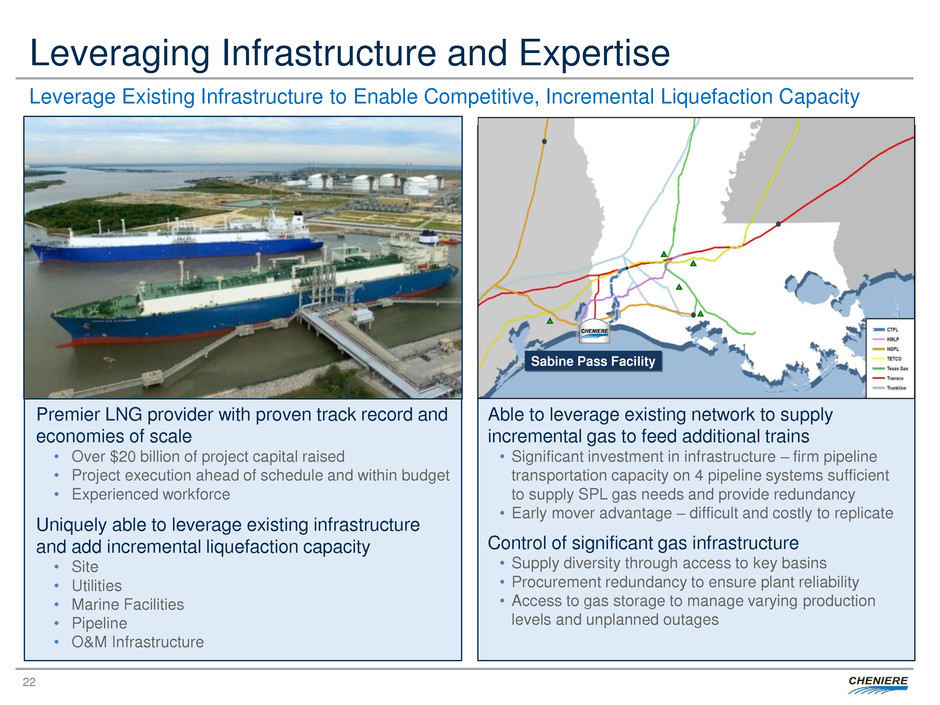
Leveraging Infrastructure and Expertise
Leverage Existing Infrastructure to Enable Competitive, Incremental Liquefaction Capacity
Able to leverage existing network to supply
incremental gas to feed additional trains
• Significant investment in infrastructure – firm pipeline
transportation capacity on 4 pipeline systems sufficient
to supply SPL gas needs and provide redundancy
• Early mover advantage – difficult and costly to replicate
Control of significant gas infrastructure
• Supply diversity through access to key basins
• Procurement redundancy to ensure plant reliability
• Access to gas storage to manage varying production
levels and unplanned outages
Premier LNG provider with proven track record and
economies of scale
• Over $20 billion of project capital raised
• Project execution ahead of schedule and within budget
• Experienced workforce
Uniquely able to leverage existing infrastructure
and add incremental liquefaction capacity
• Site
• Utilities
• Marine Facilities
• Pipeline
• O&M Infrastructure
Sabine Pass Facility
23
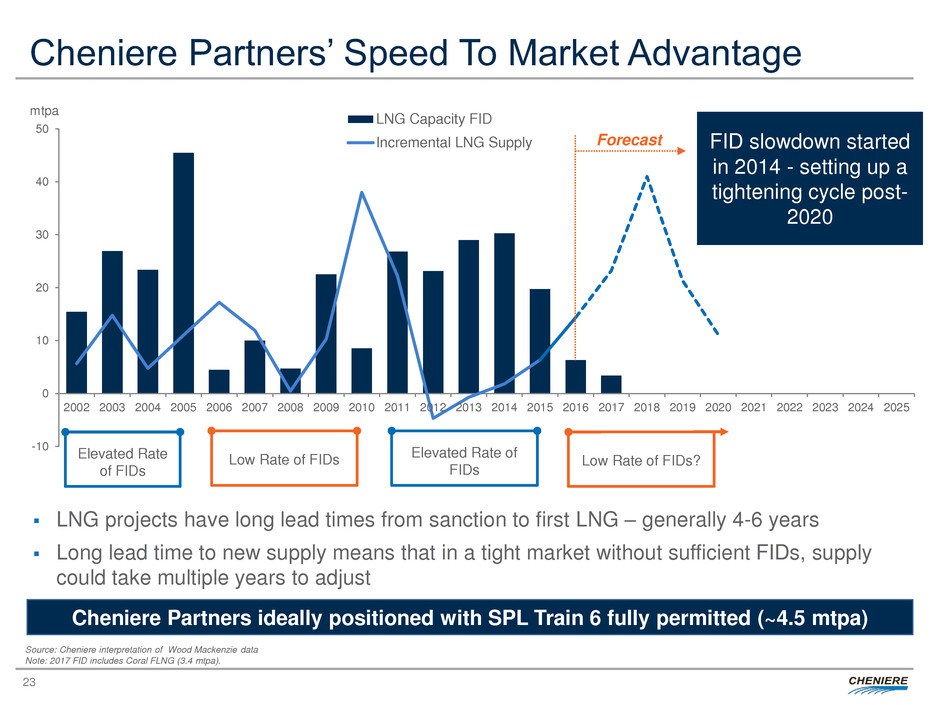
-10
0
10
20
30
40
50
2002 2003 2004 2005 2006 2007 2008 2009 2010 2011 2012 2013 2014 2015 2016 2017 2018 2019 2020 2021 2022 2023 2024 2025
mtpa
LNG Capacity FID
Incremental LNG Supply Forecast
Source: Cheniere interpretation of Wood Mackenzie data
Note: 2017 FID includes Coral FLNG (3.4 mtpa).
LNG projects have long lead times from sanction to first LNG – generally 4-6 years
Long lead time to new supply means that in a tight market without sufficient FIDs, supply
could take multiple years to adjust
Elevated Rate of
FIDs
Low Rate of FIDs Low Rate of FIDs? Elevated Rate
of FIDs
FID slowdown started
in 2014 - setting up a
tightening cycle post-
2020
Cheniere Partners’ Speed To Market Advantage
Cheniere Partners ideally positioned with SPL Train 6 fully permitted (~4.5 mtpa)
24
FINANCIAL UPDATE
25
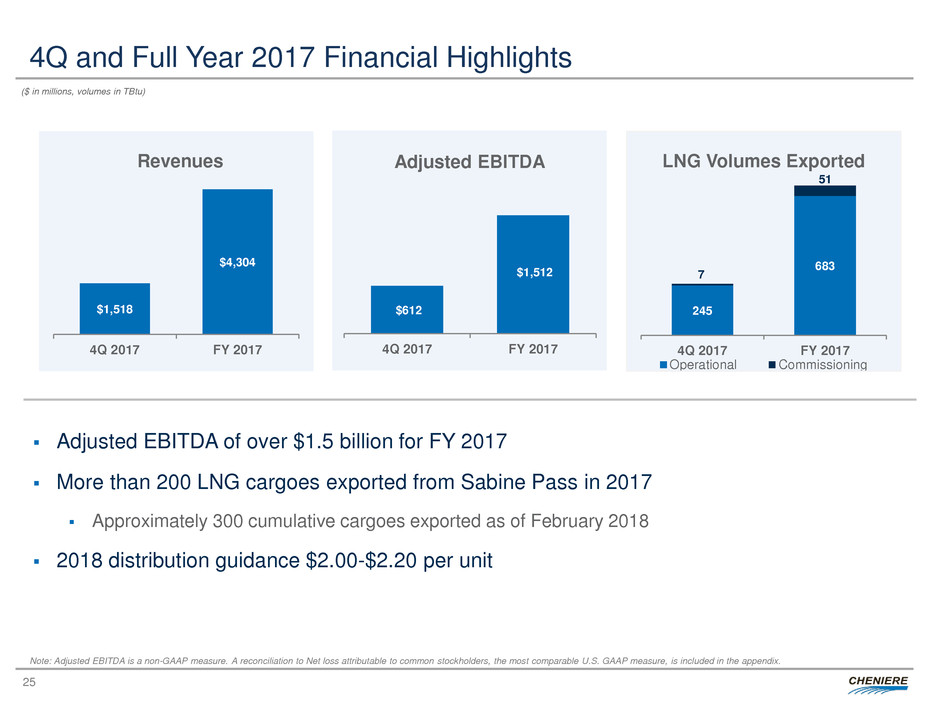
4Q and Full Year 2017 Financial Highlights
Note: Adjusted EBITDA is a non-GAAP measure. A reconciliation to Net loss attributable to common stockholders, the most comparable U.S. GAAP measure, is included in the appendix.
$612
$1,512
4Q 2017 FY 2017
Adjusted EBITDA
($ in millions, volumes in TBtu)
$1,518
$4,304
4Q 2017 FY 2017
Revenues
245
683
7
51
4Q 2017 FY 2017
LNG Volumes Exported
Operational Commissioning
Adjusted EBITDA of over $1.5 billion for FY 2017
More than 200 LNG cargoes exported from Sabine Pass in 2017
Approximately 300 cumulative cargoes exported as of February 2018
2018 distribution guidance $2.00-$2.20 per unit
26
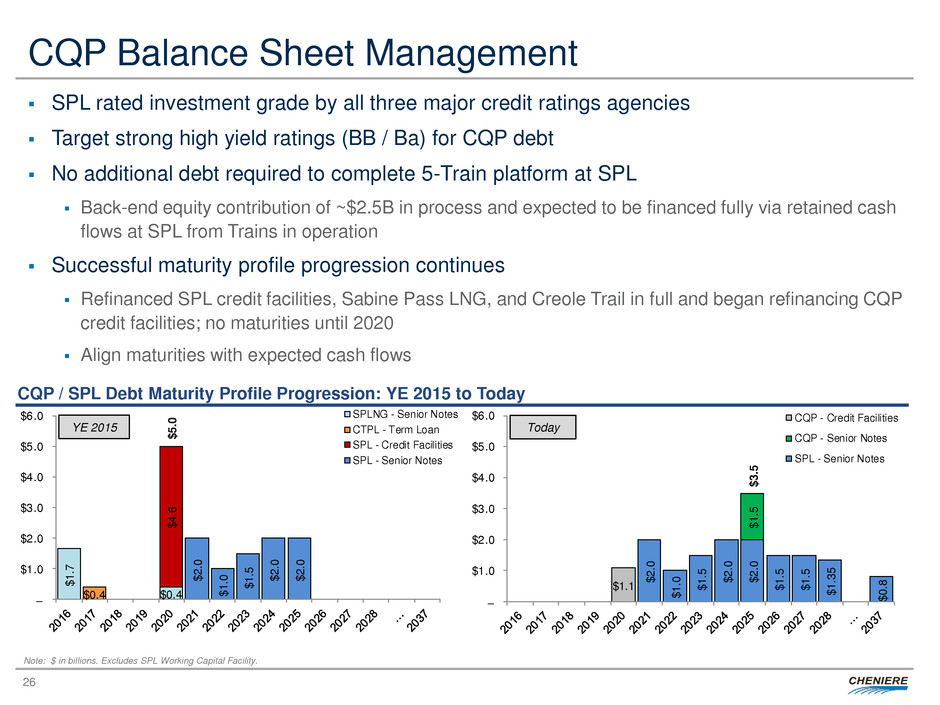
CQP Balance Sheet Management
SPL rated investment grade by all three major credit ratings agencies
Target strong high yield ratings (BB / Ba) for CQP debt
No additional debt required to complete 5-Train platform at SPL
Back-end equity contribution of ~$2.5B in process and expected to be financed fully via retained cash
flows at SPL from Trains in operation
Successful maturity profile progression continues
Refinanced SPL credit facilities, Sabine Pass LNG, and Creole Trail in full and began refinancing CQP
credit facilities; no maturities until 2020
Align maturities with expected cash flows
$1.7
$0.4 $0.4
$4.6
$5.0
$2.0
$1.0
$1.5
$2.0
$2.0
–
$1.0
$2.0
$3.0
$4.0
$5.0
$6.0 SPLNG - Senior Notes
CTPL - Term Loan
SPL - Credit Facilities
SPL - Senior Notes
$1.1
$2.0
$1.0
$1.5
$2.0
$2.0
$1.5
$1.5
$1.3
5
$0.8
$3.5
$1.5
–
$1.0
$2.0
$3.0
$4.0
$5.0
$6.0 CQP - Credit Facilities
CQP - Senior Notes
SPL - Senior Notes
CQP / SPL Debt Maturity Profile Progression: YE 2015 to Today
Today YE 2015
Note: $ in billions. Excludes SPL Working Capital Facility.
27
APPENDIX
28
Reconciliation to Non-GAAP Measures
Regulation G Reconciliations
In addition to disclosing financial results in accordance with U.S. GAAP, the accompanying news release contains non-GAAP financial measures. Adjusted EBITDA, Distributable Cash Flow and Distributable Cash Flow
per Share are non-GAAP financial measures that we use to facilitate comparisons of operating performance across periods. These non-GAAP measures should be viewed as a supplement to and not a substitute for
our U.S. GAAP measures of performance and the financial results calculated in accordance with U.S. GAAP and reconciliations from these results should be carefully evaluated.
Adjusted EBITDA represents net income (loss) attributable to Cheniere before net income (loss) attributable to the non-controlling interest, interest, taxes, depreciation and amortization, adjusted for certain non-cash
items, other non-operating income or expense items, and other items not otherwise predictive or indicative of ongoing operating performance, as detailed in the following reconciliation. Adjusted EBITDA is not intended
to represent cash flows from operations or net income (loss) as defined by U.S. GAAP and is not necessarily comparable to similarly titled measures reported by other companies.
We believe Adjusted EBITDA provides relevant and useful information to management, investors and other users of our financial information in evaluating the effectiveness of our operating performance in a manner that
is consistent with management’s evaluation of business performance. We believe Adjusted EBITDA is widely used by investors to measure a company’s operating performance without regard to items such as interest
expense, taxes, depreciation and amortization which vary substantially from company to company depending on capital structure, the method by which assets were acquired and depreciation policies. Further, the
exclusion of certain non-cash items, other non-operating income or expense items, and items not otherwise predictive or indicative of ongoing operating performance enables comparability to prior period performance
and trend analysis.
Adjusted EBITDA is calculated by taking net income (loss) attributable to common stockholders before net income (loss) attributable to non-controlling interest, interest expense, net of capitalized interest, changes in the
fair value and settlement of our interest rate derivatives, taxes, depreciation and amortization, and adjusting for the effects of certain non-cash items, other non-operating income or expense items, and other items not
otherwise predictive or indicative of ongoing operating performance, including the effects of modification or extinguishment of debt, impairment expense, changes in the fair value of our commodity and foreign exchange
currency (“FX”) derivatives and non-cash compensation expense. We believe the exclusion of these items enables investors and other users of our financial information to assess our sequential and year-over-year
performance and operating trends on a more comparable basis and is consistent with management’s own evaluation of performance.
Distributable Cash Flow is defined as net income, adjusted for certain non-cash items, less maintenance capital expenditures. Non-cash items include depreciation, depletion and amortization, non-cash compensation
expense, gains and losses on disposals of assets, the allowance for equity funds used during construction, unrealized gains and losses on commodity risk management activities, non-cash impairment charges, losses
on extinguishments of debt and deferred income taxes. Unrealized gains and losses on commodity risk management activities includes unrealized gains and losses on commodity derivatives and inventory fair value
adjustments (excluding lower of cost or market adjustments).
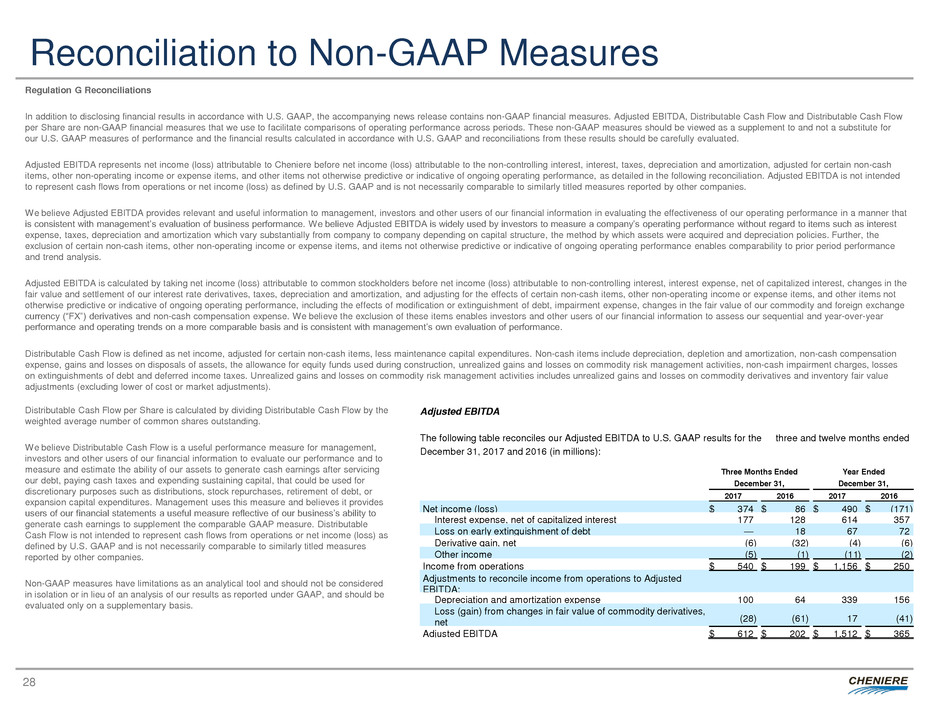
Adjusted EBITDA
The following table reconciles our Adjusted EBITDA to U.S. GAAP results for the three and twelve months ended
December 31, 2017 and 2016 (in millions):
Three Months Ended Year Ended
December 31, December 31,
2017 2016 2017 2016
Net i c me (loss) $ 374 $ 86 $ 490 $ (171 )
Interest expense, net of capitalized interest 177 128 614 357
L ss on early extinguishment of debt — 18 67 72
Derivative gain, net (6 ) (32 ) (4 ) (6 )
Oth r income (5 ) (1 ) (11 ) (2 )
In o e f m operations $ 540 $ 199 $ 1,156 $ 250
Adjustments to reconcile income from operations to Adjusted
EBITDA:
Depreciation and amortization expense 100 64 339 156
Loss (gain) from changes in fair value of commodity derivatives,
net (28 ) (61 ) 17
(41 )
Adjusted EBITDA $ 612 $ 202 $ 1,512 $ 365
Distributable Cash Flow per Share is calculated by dividing Distributable Cash Flow by the
weighted average number of common shares outstanding.
We believe Distributable Cash Flow is a useful performance measure for management,
investors and other users of our financial information to evaluate our performance and to
measure and estimate the ability of our assets to generate cash earnings after servicing
our debt, paying cash taxes and expending sustaining capital, that could be used for
discretionary purposes such as distributions, stock repurchases, retirement of debt, or
expansion capital expenditures. Management uses this measure and believes it provides
users of our financial statements a useful measure reflective of our business’s ability to
generate cash earnings to supplement the comparable GAAP measure. Distributable
Cash Flow is not intended to represent cash flows from operations or net income (loss) as
defined by U.S. GAAP and is not necessarily comparable to similarly titled measures
reported by other companies.
Non-GAAP measures have limitations as an analytical tool and should not be considered
in isolation or in lieu of an analysis of our results as reported under GAAP, and should be
evaluated only on a supplementary basis.
29
CHENIERE ENERGY PARTNERS, L.P.
INVESTOR RELATIONS CONTACTS
Randy Bhatia
Vice President, Investor Relations – (713) 375-5479, randy.bhatia@cheniere.com
Megan Light
Manager, Investor Relations – (713) 375-5492, megan.light@cheniere.com