0.0820.350220000001.000.031.00false--12-31Q120190001383650YesfalseLarge Accelerated Filerfalse00.01250.02250.00750.0175LIBOR or base rate
0.00500.056250.06250.056250.05750.05250.056250.056250.058750.05000.0420.0510000000.600.500.500.590.593000000100000099000009900000990000099000000.020.023486000001354000003486000001354000003486000001354000003486000001354000001200000000.010000000000
0001383650
2019-01-01
2019-03-31
0001383650
us-gaap:PriceRiskDerivativeMember
2019-01-01
2019-03-31
0001383650
us-gaap:InterestRateContractMember
2019-01-01
2019-03-31
0001383650
cqp:CommonUnitsMember
2019-04-30
0001383650
cqp:SubordinatedUnitsMember
2019-04-30
0001383650
2018-12-31
0001383650
2019-03-31
0001383650
cqp:SubordinatedUnitsMember
2018-12-31
0001383650
cqp:SubordinatedUnitsMember
2019-03-31
0001383650
cqp:CommonUnitsMember
2019-03-31
0001383650
2018-01-01
2018-12-31
0001383650
cqp:CommonUnitsMember
2018-12-31
0001383650
cqp:RegasificationServiceMember
2019-01-01
2019-03-31
0001383650
2018-01-01
2018-03-31
0001383650
cqp:LiquefiedNaturalGasMember
2019-01-01
2019-03-31
0001383650
cqp:LiquefiedNaturalGasMember
2018-01-01
2018-03-31
0001383650
us-gaap:ProductAndServiceOtherMember
2018-01-01
2018-03-31
0001383650
cqp:LiquefiedNaturalGasRelatedPartyMember
2019-01-01
2019-03-31
0001383650
cqp:LiquefiedNaturalGasRelatedPartyMember
2018-01-01
2018-03-31
0001383650
cqp:RegasificationServiceMember
2018-01-01
2018-03-31
0001383650
us-gaap:ProductAndServiceOtherMember
2019-01-01
2019-03-31
0001383650
cqp:SubordinatedUnitsMember
2019-01-01
2019-03-31
0001383650
us-gaap:GeneralPartnerMember
2018-12-31
0001383650
cqp:SubordinatedUnitsMember
2019-03-31
0001383650
cqp:CommonUnitsMember
2018-12-31
0001383650
cqp:CommonUnitsMember
2019-01-01
2019-03-31
0001383650
cqp:SubordinatedUnitsMember
2018-12-31
0001383650
cqp:CommonUnitsMember
2019-03-31
0001383650
us-gaap:GeneralPartnerMember
2019-03-31
0001383650
us-gaap:GeneralPartnerMember
2019-01-01
2019-03-31
0001383650
cqp:CommonUnitsMember
2017-12-31
0001383650
us-gaap:GeneralPartnerMember
2018-01-01
2018-03-31
0001383650
cqp:SubordinatedUnitsMember
2018-01-01
2018-03-31
0001383650
cqp:SubordinatedUnitsMember
2017-12-31
0001383650
us-gaap:GeneralPartnerMember
2018-03-31
0001383650
2017-12-31
0001383650
us-gaap:GeneralPartnerMember
2017-12-31
0001383650
2018-03-31
0001383650
cqp:CommonUnitsMember
2018-03-31
0001383650
cqp:CommonUnitsMember
2018-01-01
2018-03-31
0001383650
cqp:SubordinatedUnitsMember
2018-03-31
0001383650
cqp:CheniereCreoleTrailPipelineLPMember
2019-01-01
2019-03-31
0001383650
2019-01-01
0001383650
cqp:SabinePassLNGTerminalMember
2019-01-01
2019-03-31
0001383650
cqp:BlackstoneCqpHoldcoLpMember
cqp:CheniereEnergyPartnersLPMember
2019-01-01
2019-03-31
0001383650
srt:MaximumMember
us-gaap:GeneralPartnerMember
2019-01-01
2019-03-31
0001383650
srt:MinimumMember
us-gaap:GeneralPartnerMember
2019-01-01
2019-03-31
0001383650
cqp:CheniereEnergyIncMember
cqp:CheniereEnergyPartnersLPMember
2019-01-01
2019-03-31
0001383650
cqp:PublicMember
cqp:CheniereEnergyPartnersLPMember
2019-01-01
2019-03-31
0001383650
srt:MaximumMember
2019-01-01
2019-03-31
0001383650
cqp:SPLProjectMember
2018-12-31
0001383650
cqp:CQPAndCashHeldByGuarantorSubsidiariesMember
2018-12-31
0001383650
cqp:SPLProjectMember
2019-03-31
0001383650
cqp:CQPAndCashHeldByGuarantorSubsidiariesMember
2019-03-31
0001383650
cqp:NaturalGasInventoryMember
2019-03-31
0001383650
cqp:LiquefiedNaturalGasInventoryMember
2019-03-31
0001383650
cqp:MaterialsAndOtherInventoryMember
2019-03-31
0001383650
cqp:LiquefiedNaturalGasInventoryMember
2018-12-31
0001383650
cqp:NaturalGasInventoryMember
2018-12-31
0001383650
cqp:MaterialsAndOtherInventoryMember
2018-12-31
0001383650
cqp:LngTerminalCostsMember
2018-12-31
0001383650
cqp:FixedAssetsMember
2018-12-31
0001383650
cqp:FixedAssetsMember
2019-03-31
0001383650
cqp:LngTerminalMember
2018-12-31
0001383650
cqp:LngTerminalCostsMember
2019-03-31
0001383650
us-gaap:ConstructionInProgressMember
2019-03-31
0001383650
cqp:LngTerminalMember
2019-03-31
0001383650
us-gaap:ConstructionInProgressMember
2018-12-31
0001383650
us-gaap:DerivativeFinancialInstrumentsLiabilitiesMember
us-gaap:PriceRiskDerivativeMember
2018-12-31
0001383650
us-gaap:PriceRiskDerivativeMember
2019-03-31
0001383650
us-gaap:OtherCurrentAssetsMember
us-gaap:PriceRiskDerivativeMember
2019-03-31
0001383650
cqp:NoncurrentDerivativeLiabilitiesMember
us-gaap:PriceRiskDerivativeMember
2018-12-31
0001383650
cqp:NoncurrentDerivativeLiabilitiesMember
us-gaap:PriceRiskDerivativeMember
2019-03-31
0001383650
cqp:NoncurrentDerivativeAssetsMember
us-gaap:PriceRiskDerivativeMember
2019-03-31
0001383650
us-gaap:PriceRiskDerivativeMember
2018-12-31
0001383650
us-gaap:DerivativeFinancialInstrumentsLiabilitiesMember
us-gaap:PriceRiskDerivativeMember
2019-03-31
0001383650
cqp:NoncurrentDerivativeAssetsMember
us-gaap:PriceRiskDerivativeMember
2018-12-31
0001383650
us-gaap:OtherCurrentAssetsMember
us-gaap:PriceRiskDerivativeMember
2018-12-31
0001383650
us-gaap:PriceRiskDerivativeMember
us-gaap:CostOfSalesMember
2019-01-01
2019-03-31
0001383650
us-gaap:PriceRiskDerivativeMember
us-gaap:CostOfSalesMember
2018-01-01
2018-03-31
0001383650
us-gaap:PriceRiskDerivativeMember
us-gaap:SalesMember
2019-01-01
2019-03-31
0001383650
us-gaap:PriceRiskDerivativeMember
us-gaap:SalesMember
2018-01-01
2018-03-31
0001383650
cqp:SabinePassLiquefactionMember
srt:MaximumMember
2019-03-31
0001383650
srt:MaximumMember
cqp:PhysicalLiquefactionSupplyDerivativesMember
2019-01-01
2019-03-31
0001383650
cqp:SabinePassLiquefactionMember
srt:MaximumMember
2018-12-31
0001383650
us-gaap:PriceRiskDerivativeMember
us-gaap:FairValueInputsLevel3Member
2019-03-31
0001383650
us-gaap:PriceRiskDerivativeMember
us-gaap:FairValueInputsLevel1Member
2019-03-31
0001383650
us-gaap:PriceRiskDerivativeMember
us-gaap:FairValueInputsLevel1Member
2018-12-31
0001383650
us-gaap:PriceRiskDerivativeMember
us-gaap:FairValueInputsLevel2Member
2018-12-31
0001383650
us-gaap:PriceRiskDerivativeMember
us-gaap:FairValueInputsLevel2Member
2019-03-31
0001383650
us-gaap:PriceRiskDerivativeMember
us-gaap:FairValueInputsLevel3Member
2018-12-31
0001383650
cqp:PhysicalLiquefactionSupplyDerivativesMember
2018-12-31
0001383650
cqp:PhysicalLiquefactionSupplyDerivativesMember
2019-01-01
2019-03-31
0001383650
cqp:PhysicalLiquefactionSupplyDerivativesMember
2018-03-31
0001383650
cqp:PhysicalLiquefactionSupplyDerivativesMember
2018-01-01
2018-03-31
0001383650
cqp:PhysicalLiquefactionSupplyDerivativesMember
2017-12-31
0001383650
cqp:PhysicalLiquefactionSupplyDerivativesMember
2019-03-31
0001383650
cqp:PhysicalLiquefactionSupplyDerivativesMember
us-gaap:FairValueInputsLevel3Member
2019-03-31
0001383650
cqp:PriceRiskDerivativeLiabilityMember
2019-03-31
0001383650
cqp:PriceRiskDerivativeAssetMember
2018-12-31
0001383650
cqp:PriceRiskDerivativeLiabilityMember
2018-12-31
0001383650
cqp:PriceRiskDerivativeAssetMember
2019-03-31
0001383650
cqp:CQPInterestRateDerivativesMember
us-gaap:GainLossOnDerivativeInstrumentsMember
2019-01-01
2019-03-31
0001383650
cqp:CQPInterestRateDerivativesMember
us-gaap:GainLossOnDerivativeInstrumentsMember
2018-01-01
2018-03-31
0001383650
srt:MaximumMember
cqp:PhysicalLiquefactionSupplyDerivativesMember
us-gaap:FairValueInputsLevel3Member
2019-01-01
2019-03-31
0001383650
srt:MinimumMember
cqp:PhysicalLiquefactionSupplyDerivativesMember
us-gaap:FairValueInputsLevel3Member
2019-01-01
2019-03-31
0001383650
cqp:A2024SabinePassLiquefactionSeniorNotesMember
2018-12-31
0001383650
cqp:A2022SabinePassLiquefactionSeniorNotesMember
2019-03-31
0001383650
cqp:A2021SabinePassLiquefactionSeniorNotesMember
2019-03-31
0001383650
cqp:A2022SabinePassLiquefactionSeniorNotesMember
2018-12-31
0001383650
cqp:A2027SabinePassLiquefactionSeniorNotesMember
2019-03-31
0001383650
cqp:A2016CQPCreditFacilitiesMember
2018-12-31
0001383650
cqp:A2025SabinePassLiquefactionSeniorNotesMember
2019-03-31
0001383650
cqp:A2016CQPCreditFacilitiesMember
2019-03-31
0001383650
cqp:A2026SabinePassLiquefactionSeniorNotesMember
2018-12-31
0001383650
cqp:A2023SabinePassLiquefactionSeniorNotesMember
2018-12-31
0001383650
cqp:A2027SabinePassLiquefactionSeniorNotesMember
2018-12-31
0001383650
cqp:A2028SabinePassLiquefactionSeniorNotesMember
2019-03-31
0001383650
cqp:A2026SabinePassLiquefactionSeniorNotesMember
2019-03-31
0001383650
cqp:A2028SabinePassLiquefactionSeniorNotesMember
2018-12-31
0001383650
cqp:A2037SabinePassLiquefactionNotesMember
2018-12-31
0001383650
cqp:A2024SabinePassLiquefactionSeniorNotesMember
2019-03-31
0001383650
cqp:A2025SabinePassLiquefactionSeniorNotesMember
2018-12-31
0001383650
cqp:A2023SabinePassLiquefactionSeniorNotesMember
2019-03-31
0001383650
cqp:A2037SabinePassLiquefactionNotesMember
2019-03-31
0001383650
cqp:A2021SabinePassLiquefactionSeniorNotesMember
2018-12-31
0001383650
us-gaap:SeniorNotesMember
us-gaap:EstimateOfFairValueFairValueDisclosureMember
2018-12-31
0001383650
cqp:A2037SabinePassLiquefactionNotesMember
us-gaap:CarryingReportedAmountFairValueDisclosureMember
2018-12-31
0001383650
cqp:A2037SabinePassLiquefactionNotesMember
us-gaap:CarryingReportedAmountFairValueDisclosureMember
2019-03-31
0001383650
us-gaap:SeniorNotesMember
us-gaap:CarryingReportedAmountFairValueDisclosureMember
2018-12-31
0001383650
cqp:A2037SabinePassLiquefactionNotesMember
us-gaap:EstimateOfFairValueFairValueDisclosureMember
2018-12-31
0001383650
us-gaap:SeniorNotesMember
us-gaap:EstimateOfFairValueFairValueDisclosureMember
2019-03-31
0001383650
us-gaap:SeniorNotesMember
us-gaap:CarryingReportedAmountFairValueDisclosureMember
2019-03-31
0001383650
cqp:A2037SabinePassLiquefactionNotesMember
us-gaap:EstimateOfFairValueFairValueDisclosureMember
2019-03-31
0001383650
cqp:WorkingCapitalFacilityMember
2019-03-31
0001383650
cqp:A2016CQPCreditFacilitiesMember
2019-01-01
2019-03-31
0001383650
cqp:WorkingCapitalFacilityMember
2019-01-01
2019-03-31
0001383650
cqp:WorkingCapitalFacilityMember
2018-12-31
0001383650
cqp:A2016CQPCreditFacilitiesMember
us-gaap:LondonInterbankOfferedRateLIBORMember
2019-01-01
2019-03-31
0001383650
cqp:WorkingCapitalFacilityMember
us-gaap:BaseRateMember
2019-01-01
2019-03-31
0001383650
cqp:February252019Member
cqp:A2016CQPCreditFacilitiesMember
2019-01-01
2019-03-31
0001383650
cqp:A2016CQPCreditFacilitiesMember
us-gaap:BaseRateMember
2019-01-01
2019-03-31
0001383650
cqp:WorkingCapitalFacilityMember
us-gaap:LondonInterbankOfferedRateLIBORMember
2019-01-01
2019-03-31
0001383650
us-gaap:OperatingExpenseMember
2019-01-01
2019-03-31
0001383650
cqp:CurrentOperatingLeaseLiabilitiesMember
2019-03-31
0001383650
cqp:NonCurrentOperatingLeaseLiabilitiesMember
2019-03-31
0001383650
cqp:OperatingLeaseAssetsMember
2019-03-31
0001383650
cqp:DerivativeInstrumentsMember
2018-01-01
2018-03-31
0001383650
cqp:DerivativeInstrumentsMember
2019-01-01
2019-03-31
0001383650
cqp:RegasificationServiceMember
2018-12-31
0001383650
cqp:RegasificationServiceMember
2019-03-31
0001383650
cqp:LiquefiedNaturalGasMember
2018-12-31
0001383650
cqp:LiquefiedNaturalGasMember
2019-03-31
0001383650
us-gaap:ServiceAgreementsMember
2018-12-31
0001383650
cqp:SabinePassLiquefactionMember
cqp:LNGSaleandPurchaseAgreementMember
cqp:CheniereMarketingLLCMember
2019-01-01
2019-03-31
0001383650
us-gaap:ServiceAgreementsMember
2019-03-31
0001383650
cqp:SabinePassLNGLPMember
cqp:CooperativeEndeavorAgreementsMember
2019-03-31
0001383650
cqp:SabinePassLiquefactionMember
cqp:OperationAndMaintenanceAgreementMember
cqp:CheniereEnergyInvestmentsLLCMember
2019-03-31
0001383650
cqp:SabinePassTugServicesLLCMember
cqp:TerminalMarineServicesAgreementMember
us-gaap:SubsidiaryOfCommonParentMember
2019-01-01
2019-03-31
0001383650
cqp:SabinePassLiquefactionMember
cqp:ManagementServicesAgreementMember
cqp:CheniereLNGTerminalsLLCMember
2019-01-01
2019-03-31
0001383650
cqp:CheniereEnergyInvestmentsLLCMember
cqp:AmendedAndRestatedVariableCapacityRightsAgreementMember
cqp:CheniereMarketingLLCMember
2019-01-01
2019-03-31
0001383650
cqp:SabinePassLiquefactionMember
cqp:LNGTerminalUseAgreementMember
cqp:SabinePassLNGLPMember
2019-01-01
2019-03-31
0001383650
cqp:CheniereCreoleTrailPipelineLPMember
cqp:TaxSharingAgreementMember
cqp:CheniereEnergyIncMember
2019-01-01
2019-03-31
0001383650
cqp:SabinePassLiquefactionMember
cqp:OperationAndMaintenanceAgreementMember
cqp:CheniereEnergyInvestmentsLLCMember
2019-01-01
2019-03-31
0001383650
cqp:SabinePassLNGLPMember
cqp:CooperativeEndeavorAgreementsMember
2019-01-01
2019-03-31
0001383650
cqp:SabinePassLNGLPMember
cqp:OperationAndMaintenanceAgreementMember
cqp:CheniereEnergyInvestmentsLLCMember
2019-03-31
0001383650
cqp:SabinePassLiquefactionMember
cqp:TaxSharingAgreementMember
cqp:CheniereEnergyIncMember
2019-01-01
2019-03-31
0001383650
cqp:SabinePassLNGLPMember
cqp:ManagementServicesAgreementMember
cqp:CheniereLNGTerminalsLLCMember
2019-03-31
0001383650
cqp:SabinePassLiquefactionMember
cqp:ManagementServicesAgreementMember
cqp:CheniereLNGTerminalsLLCMember
2019-03-31
0001383650
cqp:SabinePassLNGLPMember
cqp:TaxSharingAgreementMember
cqp:CheniereEnergyIncMember
2019-01-01
2019-03-31
0001383650
us-gaap:ServiceAgreementsMember
2019-01-01
2019-03-31
0001383650
us-gaap:ServiceAgreementsMember
2018-01-01
2018-03-31
0001383650
cqp:SabinePassTugServicesLLCMember
cqp:TerminalMarineServicesAgreementMember
us-gaap:SubsidiaryOfCommonParentMember
2018-01-01
2018-03-31
0001383650
cqp:CheniereEnergyInvestmentsLLCMember
cqp:AmendedAndRestatedVariableCapacityRightsAgreementMember
cqp:CheniereMarketingLLCMember
2018-01-01
2018-03-31
0001383650
cqp:IncentiveDistributionRightsMember
2019-01-01
2019-03-31
0001383650
cqp:IncentiveDistributionRightsMember
2018-01-01
2018-03-31
0001383650
cqp:CommonUnitsMember
us-gaap:SubsequentEventMember
2019-04-26
2019-04-26
0001383650
cqp:SubordinatedUnitsMember
us-gaap:SubsequentEventMember
2019-04-26
2019-04-26
0001383650
cqp:CustomerAMember
us-gaap:SalesRevenueNetMember
2019-01-01
2019-03-31
0001383650
cqp:CustomerBMember
us-gaap:SalesRevenueNetMember
2018-01-01
2018-03-31
0001383650
cqp:CustomerDMember
us-gaap:AccountsReceivableMember
2019-01-01
2019-03-31
0001383650
cqp:CustomerDMember
us-gaap:SalesRevenueNetMember
2019-01-01
2019-03-31
0001383650
cqp:CustomerCMember
us-gaap:SalesRevenueNetMember
2018-01-01
2018-03-31
0001383650
cqp:CustomerAMember
us-gaap:AccountsReceivableMember
2018-01-01
2018-12-31
0001383650
cqp:CustomerBMember
us-gaap:AccountsReceivableMember
2019-01-01
2019-03-31
0001383650
cqp:CustomerBMember
us-gaap:SalesRevenueNetMember
2019-01-01
2019-03-31
0001383650
cqp:CustomerAMember
us-gaap:SalesRevenueNetMember
2018-01-01
2018-03-31
0001383650
cqp:CustomerCMember
us-gaap:AccountsReceivableMember
2019-01-01
2019-03-31
0001383650
cqp:CustomerCMember
us-gaap:SalesRevenueNetMember
2019-01-01
2019-03-31
0001383650
cqp:CustomerBMember
us-gaap:AccountsReceivableMember
2018-01-01
2018-12-31
0001383650
cqp:CustomerCMember
us-gaap:AccountsReceivableMember
2018-01-01
2018-12-31
0001383650
cqp:CustomerAMember
us-gaap:AccountsReceivableMember
2019-01-01
2019-03-31
0001383650
srt:NonGuarantorSubsidiariesMember
2018-03-31
0001383650
srt:ConsolidationEliminationsMember
2018-01-01
2018-03-31
0001383650
srt:ParentCompanyMember
2018-01-01
2018-03-31
0001383650
srt:NonGuarantorSubsidiariesMember
2018-01-01
2018-03-31
0001383650
srt:ParentCompanyMember
2017-12-31
0001383650
srt:NonGuarantorSubsidiariesMember
2017-12-31
0001383650
srt:ParentCompanyMember
2018-03-31
0001383650
srt:GuarantorSubsidiariesMember
2018-01-01
2018-03-31
0001383650
srt:ConsolidationEliminationsMember
2017-12-31
0001383650
srt:ConsolidationEliminationsMember
2018-03-31
0001383650
srt:GuarantorSubsidiariesMember
2018-03-31
0001383650
srt:GuarantorSubsidiariesMember
2017-12-31
0001383650
srt:GuarantorSubsidiariesMember
2019-01-01
2019-03-31
0001383650
srt:ConsolidationEliminationsMember
2019-01-01
2019-03-31
0001383650
srt:ParentCompanyMember
2019-01-01
2019-03-31
0001383650
srt:ConsolidationEliminationsMember
cqp:ProductAndServiceOtherRelatedPartyMember
2019-01-01
2019-03-31
0001383650
srt:NonGuarantorSubsidiariesMember
2019-01-01
2019-03-31
0001383650
srt:ParentCompanyMember
cqp:LiquefiedNaturalGasRelatedPartyMember
2019-01-01
2019-03-31
0001383650
srt:ConsolidationEliminationsMember
cqp:RegasificationServiceRelatedPartyMember
2019-01-01
2019-03-31
0001383650
srt:ConsolidationEliminationsMember
cqp:LiquefiedNaturalGasRelatedPartyMember
2019-01-01
2019-03-31
0001383650
cqp:RegasificationServiceRelatedPartyMember
2019-01-01
2019-03-31
0001383650
srt:ParentCompanyMember
cqp:ProductAndServiceOtherRelatedPartyMember
2019-01-01
2019-03-31
0001383650
srt:ParentCompanyMember
cqp:RegasificationServiceRelatedPartyMember
2019-01-01
2019-03-31
0001383650
srt:ParentCompanyMember
us-gaap:ProductAndServiceOtherMember
2019-01-01
2019-03-31
0001383650
srt:GuarantorSubsidiariesMember
cqp:RegasificationServiceRelatedPartyMember
2019-01-01
2019-03-31
0001383650
srt:ConsolidationEliminationsMember
cqp:LiquefiedNaturalGasMember
2019-01-01
2019-03-31
0001383650
srt:ParentCompanyMember
cqp:LiquefiedNaturalGasMember
2019-01-01
2019-03-31
0001383650
srt:GuarantorSubsidiariesMember
cqp:ProductAndServiceOtherRelatedPartyMember
2019-01-01
2019-03-31
0001383650
srt:ParentCompanyMember
cqp:RegasificationServiceMember
2019-01-01
2019-03-31
0001383650
srt:NonGuarantorSubsidiariesMember
cqp:RegasificationServiceMember
2019-01-01
2019-03-31
0001383650
srt:ConsolidationEliminationsMember
us-gaap:ProductAndServiceOtherMember
2019-01-01
2019-03-31
0001383650
srt:GuarantorSubsidiariesMember
us-gaap:ProductAndServiceOtherMember
2019-01-01
2019-03-31
0001383650
srt:GuarantorSubsidiariesMember
cqp:LiquefiedNaturalGasMember
2019-01-01
2019-03-31
0001383650
srt:NonGuarantorSubsidiariesMember
cqp:RegasificationServiceRelatedPartyMember
2019-01-01
2019-03-31
0001383650
srt:NonGuarantorSubsidiariesMember
us-gaap:ProductAndServiceOtherMember
2019-01-01
2019-03-31
0001383650
srt:GuarantorSubsidiariesMember
cqp:RegasificationServiceMember
2019-01-01
2019-03-31
0001383650
srt:NonGuarantorSubsidiariesMember
cqp:LiquefiedNaturalGasRelatedPartyMember
2019-01-01
2019-03-31
0001383650
srt:GuarantorSubsidiariesMember
cqp:LiquefiedNaturalGasRelatedPartyMember
2019-01-01
2019-03-31
0001383650
srt:NonGuarantorSubsidiariesMember
cqp:ProductAndServiceOtherRelatedPartyMember
2019-01-01
2019-03-31
0001383650
srt:ConsolidationEliminationsMember
cqp:RegasificationServiceMember
2019-01-01
2019-03-31
0001383650
srt:NonGuarantorSubsidiariesMember
cqp:LiquefiedNaturalGasMember
2019-01-01
2019-03-31
0001383650
cqp:ProductAndServiceOtherRelatedPartyMember
2019-01-01
2019-03-31
0001383650
srt:NonGuarantorSubsidiariesMember
2019-03-31
0001383650
srt:GuarantorSubsidiariesMember
2019-03-31
0001383650
srt:ParentCompanyMember
2019-03-31
0001383650
srt:ConsolidationEliminationsMember
2019-03-31
0001383650
srt:GuarantorSubsidiariesMember
cqp:RegasificationServiceRelatedPartyMember
2018-01-01
2018-03-31
0001383650
srt:NonGuarantorSubsidiariesMember
cqp:ProductAndServiceOtherRelatedPartyMember
2018-01-01
2018-03-31
0001383650
srt:ParentCompanyMember
cqp:LiquefiedNaturalGasMember
2018-01-01
2018-03-31
0001383650
srt:NonGuarantorSubsidiariesMember
cqp:LiquefiedNaturalGasMember
2018-01-01
2018-03-31
0001383650
srt:ConsolidationEliminationsMember
cqp:ProductAndServiceOtherRelatedPartyMember
2018-01-01
2018-03-31
0001383650
srt:NonGuarantorSubsidiariesMember
cqp:RegasificationServiceMember
2018-01-01
2018-03-31
0001383650
cqp:ProductAndServiceOtherRelatedPartyMember
2018-01-01
2018-03-31
0001383650
srt:NonGuarantorSubsidiariesMember
cqp:LiquefiedNaturalGasRelatedPartyMember
2018-01-01
2018-03-31
0001383650
srt:ParentCompanyMember
cqp:RegasificationServiceMember
2018-01-01
2018-03-31
0001383650
srt:ConsolidationEliminationsMember
cqp:LiquefiedNaturalGasRelatedPartyMember
2018-01-01
2018-03-31
0001383650
srt:ConsolidationEliminationsMember
cqp:RegasificationServiceMember
2018-01-01
2018-03-31
0001383650
srt:GuarantorSubsidiariesMember
cqp:LiquefiedNaturalGasRelatedPartyMember
2018-01-01
2018-03-31
0001383650
srt:ParentCompanyMember
cqp:ProductAndServiceOtherRelatedPartyMember
2018-01-01
2018-03-31
0001383650
srt:NonGuarantorSubsidiariesMember
cqp:RegasificationServiceRelatedPartyMember
2018-01-01
2018-03-31
0001383650
srt:ParentCompanyMember
cqp:LiquefiedNaturalGasRelatedPartyMember
2018-01-01
2018-03-31
0001383650
srt:ConsolidationEliminationsMember
cqp:RegasificationServiceRelatedPartyMember
2018-01-01
2018-03-31
0001383650
srt:ParentCompanyMember
cqp:RegasificationServiceRelatedPartyMember
2018-01-01
2018-03-31
0001383650
srt:GuarantorSubsidiariesMember
us-gaap:ProductAndServiceOtherMember
2018-01-01
2018-03-31
0001383650
srt:ConsolidationEliminationsMember
us-gaap:ProductAndServiceOtherMember
2018-01-01
2018-03-31
0001383650
srt:ConsolidationEliminationsMember
cqp:LiquefiedNaturalGasMember
2018-01-01
2018-03-31
0001383650
srt:GuarantorSubsidiariesMember
cqp:RegasificationServiceMember
2018-01-01
2018-03-31
0001383650
srt:GuarantorSubsidiariesMember
cqp:ProductAndServiceOtherRelatedPartyMember
2018-01-01
2018-03-31
0001383650
srt:ParentCompanyMember
us-gaap:ProductAndServiceOtherMember
2018-01-01
2018-03-31
0001383650
srt:GuarantorSubsidiariesMember
cqp:LiquefiedNaturalGasMember
2018-01-01
2018-03-31
0001383650
srt:NonGuarantorSubsidiariesMember
us-gaap:ProductAndServiceOtherMember
2018-01-01
2018-03-31
0001383650
cqp:RegasificationServiceRelatedPartyMember
2018-01-01
2018-03-31
0001383650
srt:NonGuarantorSubsidiariesMember
2018-12-31
0001383650
srt:GuarantorSubsidiariesMember
2018-12-31
0001383650
srt:ConsolidationEliminationsMember
2018-12-31
0001383650
srt:ParentCompanyMember
2018-12-31
xbrli:shares
iso4217:USD
utreg:MMBTU
iso4217:USD
utreg:mi
cqp:tbtu
utreg:bcf
utreg:D
cqp:trains
xbrli:pure
iso4217:USD
xbrli:shares
UNITED STATES
SECURITIES AND EXCHANGE COMMISSION
Washington, D.C. 20549
FORM 10-Q
x QUARTERLY REPORT PURSUANT TO SECTION 13 OR 15(d) OF THE SECURITIES EXCHANGE ACT OF 1934
For the quarterly period ended March 31, 2019
or
¨ TRANSITION REPORT PURSUANT TO SECTION 13 OR 15(d) OF THE SECURITIES EXCHANGE ACT OF 1934
For the transition period from to
Commission file number 001-33366
Cheniere Energy Partners, L.P.
(Exact name of registrant as specified in its charter)
|
| |
Delaware | 20-5913059 |
(State or other jurisdiction of incorporation or organization) | (I.R.S. Employer Identification No.) |
| |
700 Milam Street, Suite 1900 Houston, Texas | 77002 |
(Address of principal executive offices) | (Zip Code) |
(713) 375-5000
(Registrant’s telephone number, including area code)
Indicate by check mark whether the registrant (1) has filed all reports required to be filed by Section 13 or 15(d) of the Securities Exchange Act of 1934 during the preceding 12 months (or for such shorter period that the registrant was required to file such reports), and (2) has been subject to such filing requirements for the past 90 days. Yes x No ¨
Indicate by check mark whether the registrant has submitted electronically every Interactive Data File required to be submitted pursuant to Rule 405 of Regulation S-T (§232.405 of this chapter) during the preceding 12 months (or for such shorter period that the registrant was required to submit such files). Yes x No ¨
Indicate by check mark whether the registrant is a large accelerated filer, an accelerated filer, a non-accelerated filer, a smaller reporting company, or an emerging growth company. See the definitions of “large accelerated filer,” “accelerated filer,” “smaller reporting company” and “emerging growth company” in Rule 12b-2 of the Exchange Act.
|
| |
Large accelerated filer x | Accelerated filer o |
Non-accelerated filer o | Smaller reporting company o |
| Emerging growth company o |
If an emerging growth company, indicate by check mark if the registrant has elected not to use the extended transition period for complying with any new or revised financial accounting standards provided pursuant to Section 13(a) of the Exchange Act. ¨
Indicate by check mark whether the registrant is a shell company (as defined in Rule 12b-2 of the Exchange Act). Yes ¨ No x
Securities registered pursuant to Section 12(b) of the Act:
|
| | |
Title of each class | Trading Symbol | Name of each exchange on which registered |
Common Units Representing Limited Partner Interests | CQP | NYSE American |
As of April 30, 2019, the registrant had 348,625,292 common units and 135,383,831 subordinated units outstanding.
CHENIERE ENERGY PARTNERS, L.P.
TABLE OF CONTENTS
DEFINITIONS
As used in this quarterly report, the terms listed below have the following meanings:
Common Industry and Other Terms
|
| | |
Bcf | | billion cubic feet |
Bcf/d | | billion cubic feet per day |
Bcf/yr | | billion cubic feet per year |
Bcfe | | billion cubic feet equivalent |
DOE | | U.S. Department of Energy |
EPC | | engineering, procurement and construction |
FERC | | Federal Energy Regulatory Commission |
FTA countries | | countries with which the United States has a free trade agreement providing for national treatment for trade in natural gas |
GAAP | | generally accepted accounting principles in the United States |
Henry Hub | | the final settlement price (in USD per MMBtu) for the New York Mercantile Exchange’s Henry Hub natural gas futures contract for the month in which a relevant cargo’s delivery window is scheduled to begin |
LIBOR | | London Interbank Offered Rate |
LNG | | liquefied natural gas, a product of natural gas that, through a refrigeration process, has been cooled to a liquid state, which occupies a volume that is approximately 1/600th of its gaseous state |
MMBtu | | million British thermal units, an energy unit |
mtpa | | million tonnes per annum |
non-FTA countries | | countries with which the United States does not have a free trade agreement providing for national treatment for trade in natural gas and with which trade is permitted |
SEC | | U.S. Securities and Exchange Commission |
SPA | | LNG sale and purchase agreement |
TBtu | | trillion British thermal units, an energy unit |
Train | | an industrial facility comprised of a series of refrigerant compressor loops used to cool natural gas into LNG |
TUA | | terminal use agreement |
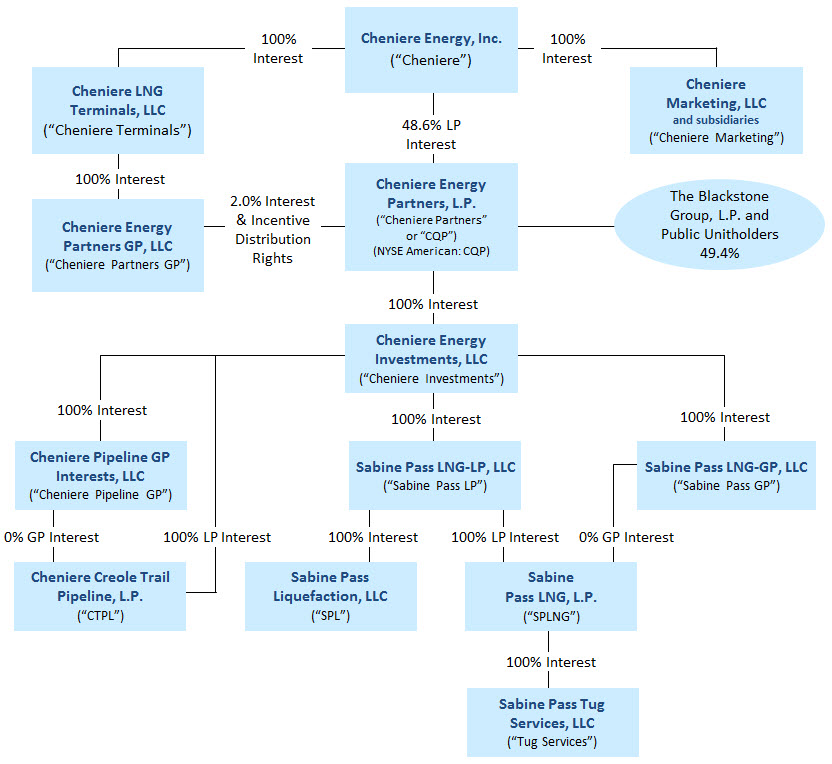
Abbreviated Legal Entity Structure
The following diagram depicts our abbreviated legal entity structure as of March 31, 2019, including our ownership of certain subsidiaries, and the references to these entities used in this quarterly report:
Unless the context requires otherwise, references to “Cheniere Partners,” “the Partnership,” “we,” “us” and “our” refer to Cheniere Energy Partners, L.P. and its consolidated subsidiaries, including SPLNG, SPL and CTPL.
References to “Blackstone Group” refer to The Blackstone Group, L.P. References to “Blackstone CQP Holdco” refer to Blackstone CQP Holdco LP. References to “Blackstone” refer to Blackstone Group and Blackstone CQP Holdco.
| |
PART I. | FINANCIAL INFORMATION |
| |
ITEM 1. | CONSOLIDATED FINANCIAL STATEMENTS |
CHENIERE ENERGY PARTNERS, L.P. AND SUBSIDIARIES
CONSOLIDATED BALANCE SHEETS
(in millions, except unit data)
|
| | | | | | | | |
| | March 31, | | December 31, |
| | 2019 | | 2018 |
ASSETS | | (unaudited) | | |
Current assets | | | | |
Cash and cash equivalents | | $ | — |
| | $ | — |
|
Restricted cash | | 1,297 |
| | 1,541 |
|
Accounts and other receivables | | 208 |
| | 348 |
|
Accounts receivable—affiliate | | 113 |
| | 114 |
|
Advances to affiliate | | 316 |
| | 228 |
|
Inventory | | 109 |
| | 99 |
|
Other current assets | | 46 |
| | 26 |
|
Other current assets—affiliate | | 1 |
| | — |
|
Total current assets | | 2,090 |
| | 2,356 |
|
| | | | |
Property, plant and equipment, net | | 15,615 |
| | 15,390 |
|
Operating lease assets, net | | 93 |
| | — |
|
Debt issuance costs, net | | 11 |
| | 13 |
|
Non-current derivative assets | | 36 |
| | 31 |
|
Other non-current assets, net | | 160 |
| | 184 |
|
Total assets | | $ | 18,005 |
| | $ | 17,974 |
|
| | | | |
LIABILITIES AND PARTNERS’ EQUITY | | | | |
Current liabilities | | | | |
Accounts payable | | $ | 31 |
| | $ | 15 |
|
Accrued liabilities | | 725 |
| | 821 |
|
Due to affiliates | | 51 |
| | 49 |
|
Deferred revenue | | 106 |
| | 116 |
|
Deferred revenue—affiliate | | — |
| | 1 |
|
Current operating lease liabilities | | 5 |
| | — |
|
Derivative liabilities | | 10 |
| | 66 |
|
Total current liabilities | | 928 |
| | 1,068 |
|
| | | | |
Long-term debt, net | | 16,073 |
| | 16,066 |
|
Non-current operating lease liabilities | | 87 |
| | — |
|
Non-current derivative liabilities | | 10 |
| | 14 |
|
Other non-current liabilities | | 4 |
| | 4 |
|
Other non-current liabilities—affiliate | | 22 |
| | 22 |
|
| | | | |
Partners’ equity | | | | |
Common unitholders’ interest (348.6 million units issued and outstanding at March 31, 2019 and December 31, 2018) | | 1,872 |
| | 1,806 |
|
Subordinated unitholders’ interest (135.4 million units issued and outstanding at March 31, 2019 and December 31, 2018) | | (965 | ) | | (990 | ) |
General partner’s interest (2% interest with 9.9 million units issued and outstanding at March 31, 2019 and December 31, 2018) | | (26 | ) | | (16 | ) |
Total partners’ equity | | 881 |
|
| 800 |
|
Total liabilities and partners’ equity | | $ | 18,005 |
| | $ | 17,974 |
|
The accompanying notes are an integral part of these consolidated financial statements.
3
CHENIERE ENERGY PARTNERS, L.P. AND SUBSIDIARIES
CONSOLIDATED STATEMENTS OF INCOME
(in millions, except per unit data)
(unaudited)
|
| | | | | | | |
| Three Months Ended March 31, |
| 2019 | | 2018 |
Revenues | | | |
LNG revenues | $ | 1,367 |
| | $ | 1,015 |
|
LNG revenues—affiliate | 305 |
| | 503 |
|
Regasification revenues | 66 |
| | 65 |
|
Other revenues | 11 |
| | 10 |
|
Total revenues | 1,749 |
| | 1,593 |
|
| | | |
Operating costs and expenses | | | |
Cost of sales (excluding depreciation and amortization expense shown separately below) | 879 |
| | 837 |
|
Operating and maintenance expense | 138 |
| | 95 |
|
Operating and maintenance expense—affiliate | 29 |
| | 26 |
|
General and administrative expense | 3 |
| | 4 |
|
General and administrative expense—affiliate | 21 |
| | 18 |
|
Depreciation and amortization expense | 114 |
| | 105 |
|
Impairment expense and loss on disposal of assets | 2 |
| | — |
|
Total operating costs and expenses | 1,186 |
| | 1,085 |
|
| | | |
Income from operations | 563 |
| | 508 |
|
| | | |
Other income (expense) | | | |
Interest expense, net of capitalized interest | (187 | ) | | (185 | ) |
Derivative gain, net | — |
| | 8 |
|
Other income | 9 |
| | 4 |
|
Total other expense | (178 | ) | | (173 | ) |
| | | |
Net income | $ | 385 |
| | $ | 335 |
|
| | | |
Basic and diluted net income per common unit | $ | 0.75 |
| | $ | 0.67 |
|
| | | |
Weighted average number of common units outstanding used for basic and diluted net income per common unit calculation | 348.6 |
| | 348.6 |
|
The accompanying notes are an integral part of these consolidated financial statements.
4
CHENIERE ENERGY PARTNERS, L.P. AND SUBSIDIARIES
CONSOLIDATED STATEMENTS OF PARTNERS’ EQUITY
(in millions)
(unaudited)
|
| | | | | | | | | | | | | | | | | | | | | | | | |
Three Months Ended March 31, 2019 | | | | | | | | | | | | | |
| Common Unitholders’ Interest | | Subordinated Unitholder’s Interest | | General Partner’s Interest | | Total Partners’ Equity |
| Units | | Amount | | Units | | Amount | | Units | | Amount | |
Balance at December 31, 2018 | 348.6 |
|
| $ | 1,806 |
|
| 135.4 |
|
| $ | (990 | ) |
| 9.9 |
|
| $ | (16 | ) |
| $ | 800 |
|
Net income | — |
| | 272 |
| | — |
| | 105 |
| | — |
| | 8 |
| | 385 |
|
Distributions | | | | | | | | | | | | |
|
|
Common units, $0.59/unit | — |
| | (206 | ) | | — |
| | — |
| | — |
| | — |
| | (206 | ) |
Subordinated units, $0.59/unit | — |
| | — |
| | — |
| | (80 | ) | | — |
| | — |
| | (80 | ) |
General partner units | — |
| | — |
| | — |
| | — |
| | — |
| | (18 | ) | | (18 | ) |
Balance at March 31, 2019 | 348.6 |
| | $ | 1,872 |
| | 135.4 |
| | $ | (965 | ) | | 9.9 |
| | $ | (26 | ) | | $ | 881 |
|
|
| | | | | | | | | | | | | | | | | | | | | | | | |
Three Months Ended March 31, 2018 | | | | | | | | | | | | | |
| Common Unitholders’ Interest | | Subordinated Unitholder’s Interest | | General Partner’s Interest | | Total Partners’ Equity |
| Units | | Amount | | Units | | Amount | | Units | | Amount | |
Balance at December 31, 2017 | 348.6 |
| | $ | 1,670 |
| | 135.4 |
| | $ | (1,043 | ) | | 9.9 |
| | $ | 12 |
| | $ | 639 |
|
Net income | — |
| | 236 |
| | — |
| | 92 |
| | — |
| | 7 |
| | 335 |
|
Distributions | | | | | | | | | | | | |
|
|
Common units, $0.50/unit | — |
| | (175 | ) | | — |
| | — |
| | — |
| | — |
| | (175 | ) |
Subordinated units, $0.50/unit | — |
| | — |
| | — |
| | (68 | ) | | — |
| | — |
| | (68 | ) |
General partner units | — |
| | — |
| | — |
| | — |
| | — |
| | (6 | ) | | (6 | ) |
Balance at March 31, 2018 | 348.6 |
| | $ | 1,731 |
| | 135.4 |
| | $ | (1,019 | ) | | 9.9 |
| | $ | 13 |
| | $ | 725 |
|
The accompanying notes are an integral part of these consolidated financial statements.
5
CHENIERE ENERGY PARTNERS, L.P. AND SUBSIDIARIES
CONSOLIDATED STATEMENTS OF CASH FLOWS
(in millions)
(unaudited)
|
| | | | | | | |
| Three Months Ended March 31, |
| 2019 | | 2018 |
Cash flows from operating activities | | | |
Net income | $ | 385 |
| | $ | 335 |
|
Adjustments to reconcile net income to net cash provided by operating activities: | | | |
Depreciation and amortization expense | 114 |
| | 105 |
|
Amortization of debt issuance costs, deferred commitment fees, premium and discount | 6 |
| | 8 |
|
Total losses (gains) on derivatives, net | (77 | ) | | 42 |
|
Net cash provided by (used for) settlement of derivative instruments | 5 |
| | (3 | ) |
Impairment expense and loss on disposal of assets | 2 |
| | — |
|
Other | 2 |
| | 2 |
|
Changes in operating assets and liabilities: | | | |
Accounts and other receivables | 105 |
| | (50 | ) |
Accounts receivable—affiliate | 1 |
| | 48 |
|
Advances to affiliate | (26 | ) | | (56 | ) |
Inventory | (9 | ) | | 12 |
|
Accounts payable and accrued liabilities | (131 | ) | | (69 | ) |
Due to affiliates | (14 | ) | | (25 | ) |
Deferred revenue | (10 | ) | | (18 | ) |
Other, net | (7 | ) | | — |
|
Other, net—affiliate | (2 | ) | | — |
|
Net cash provided by operating activities | 344 |
| | 331 |
|
| | | |
Cash flows from investing activities | |
| | |
|
Property, plant and equipment, net | (283 | ) | | (194 | ) |
Other | (1 | ) | | — |
|
Net cash used in investing activities | (284 | ) | | (194 | ) |
| | | |
Cash flows from financing activities | |
| | |
|
Distributions to owners | (304 | ) | | (249 | ) |
Net cash used in financing activities | (304 | ) | | (249 | ) |
| | | |
Net decrease in cash, cash equivalents and restricted cash | (244 | ) | | (112 | ) |
Cash, cash equivalents and restricted cash—beginning of period | 1,541 |
| | 1,589 |
|
Cash, cash equivalents and restricted cash—end of period | $ | 1,297 |
| | $ | 1,477 |
|
Balances per Consolidated Balance Sheet:
|
| | | |
| March 31, |
| 2019 |
Cash and cash equivalents | $ | — |
|
Restricted cash | 1,297 |
|
Total cash, cash equivalents and restricted cash | $ | 1,297 |
|
The accompanying notes are an integral part of these consolidated financial statements.
6
CHENIERE ENERGY PARTNERS, L.P. AND SUBSIDIARIES
NOTES TO CONSOLIDATED FINANCIAL STATEMENTS
(unaudited)
NOTE 1—NATURE OF OPERATIONS AND BASIS OF PRESENTATION
Through SPL, we are developing, constructing and operating natural gas liquefaction facilities (the “Liquefaction Project”) at the Sabine Pass LNG terminal located in Cameron Parish, Louisiana, on the Sabine-Neches Waterway less than four miles from the Gulf Coast. We plan to construct up to six Trains, which are in various stages of development, construction and operations. Trains 1 through 5 are operational and early works have begun for Train 6 under limited notices to proceed ahead of an anticipated positive final investment decision. The Sabine Pass LNG terminal has operational regasification facilities owned by SPLNG and a 94-mile pipeline that interconnects the Sabine Pass LNG terminal with a number of large interstate pipelines through our wholly owned subsidiary, CTPL.
Basis of Presentation
The accompanying unaudited Consolidated Financial Statements of Cheniere Partners have been prepared in accordance with GAAP for interim financial information and with Rule 10-01 of Regulation S-X. Accordingly, they do not include all of the information and footnotes required by GAAP for complete financial statements and should be read in conjunction with the Consolidated Financial Statements and accompanying notes included in our annual report on Form 10-K for the year ended December 31, 2018.
Results of operations for the three months ended March 31, 2019 are not necessarily indicative of the results of operations that will be realized for the year ending December 31, 2019.
We are not subject to either federal or state income tax, as our partners are taxed individually on their allocable share of our taxable income.
Recent Accounting Standards
We adopted ASU 2016-02, Leases (Topic 842), and subsequent amendments thereto (“ASC 842”) on January 1, 2019 using the optional transition approach to apply the standard at the beginning of the first quarter of 2019 with no retrospective adjustments to prior periods. The adoption of the standard resulted in the recognition of right-of-use assets and lease liabilities for operating leases of approximately $100 million on our Consolidated Balance Sheets, with no material impact on our Consolidated Statements of Income or Consolidated Statements of Cash Flows. We have elected the practical expedients to (1) carryforward prior conclusions related to lease identification and classification for existing leases, (2) combine lease and non-lease components of an arrangement for all classes of leased assets, (3) omit short-term leases with a term of 12 months or less from recognition on the balance sheet and (4) carryforward our existing accounting for land easements not previously accounted for as leases. See Note 11—Leases for additional information on our leases following the adoption of this standard.
NOTE 2—UNITHOLDERS’ EQUITY
The common units and subordinated units represent limited partner interests in us. The holders of the units are entitled to participate in partnership distributions and exercise the rights and privileges available to limited partners under our partnership agreement. Our partnership agreement requires that, within 45 days after the end of each quarter, we distribute all of our available cash (as defined in our partnership agreement). Generally, our available cash is our cash on hand at the end of a quarter less the amount of any reserves established by our general partner. All distributions paid to date have been made from operating surplus as defined in the partnership agreement.
The holders of common units have the right to receive initial quarterly distributions of $0.425 per common unit, plus any arrearages thereon, before any distribution is made to the holders of the subordinated units. The holders of subordinated units will receive distributions only to the extent we have available cash above the initial quarterly distribution requirement for our common unitholders and general partner and certain reserves. Subordinated units will convert into common units on a one-for-one basis when we meet financial tests specified in the partnership agreement. Although common and subordinated unitholders are not obligated to fund losses of the Partnership, their capital accounts, which would be considered in allocating the net assets of the Partnership were it to be liquidated, continue to share in losses.
CHENIERE ENERGY PARTNERS, L.P. AND SUBSIDIARIES
NOTES TO CONSOLIDATED FINANCIAL STATEMENTS—CONTINUED
(unaudited)
The general partner interest is entitled to at least 2% of all distributions made by us. In addition, the general partner holds incentive distribution rights (“IDRs”), which allow the general partner to receive a higher percentage of quarterly distributions of available cash from operating surplus after the initial quarterly distributions have been achieved and as additional target levels are met, but may transfer these rights separately from its general partner interest. The higher percentages range from 15% to 50%, inclusive of the general partner interest.
As of March 31, 2019, Cheniere, Blackstone CQP Holdco and the public owned a 48.6%, 40.3% and 9.1% interest in us, respectively. Cheniere’s ownership percentage includes its subordinated units and Blackstone CQP Holdco’s ownership percentage excludes any common units that may be deemed to be beneficially owned by Blackstone Group, an affiliate of Blackstone CQP Holdco.
NOTE 3—RESTRICTED CASH
Restricted cash consists of funds that are contractually restricted as to usage or withdrawal and have been presented separately from cash and cash equivalents on our Consolidated Balance Sheets. As of March 31, 2019 and December 31, 2018, restricted cash consisted of the following (in millions):
|
| | | | | | | | |
| | March 31, | | December 31, |
| | 2019 | | 2018 |
Current restricted cash | | | | |
Liquefaction Project | | $ | 621 |
| | $ | 756 |
|
Cash held by us and our guarantor subsidiaries | | 676 |
| | 785 |
|
Total current restricted cash | | $ | 1,297 |
| | $ | 1,541 |
|
Pursuant to the accounts agreement entered into with the collateral trustee for the benefit of SPL’s debt holders, SPL is required to deposit all cash received into reserve accounts controlled by the collateral trustee. The usage or withdrawal of such cash is restricted to the payment of liabilities related to the Liquefaction Project and other restricted payments.
Under our credit facilities (the “CQP Credit Facilities”), we and each of our subsidiaries other than (1) SPL and (2) certain of our subsidiaries owning other development projects, as well as certain other specified subsidiaries and members of the foregoing entities, as our guarantor subsidiaries, are subject to limitations on the use of cash under the terms of the CQP Credit Facilities and the related depositary agreement governing the extension of credit to us. Specifically, we may only withdraw funds from collateral accounts held at a designated depositary bank on a limited basis and for specific purposes, including for the payment of our operating expenses and the operating expenses of our guarantor subsidiaries. In addition, distributions and capital expenditures may only be made quarterly and are subject to certain restrictions.
NOTE 4—ACCOUNTS AND OTHER RECEIVABLES
As of March 31, 2019 and December 31, 2018, accounts and other receivables consisted of the following (in millions):
|
| | | | | | | | |
| | March 31, | | December 31, |
| | 2019 | | 2018 |
SPL trade receivable | | $ | 187 |
| | $ | 330 |
|
Other accounts receivable | | 21 |
| | 18 |
|
Total accounts and other receivables | | $ | 208 |
| | $ | 348 |
|
NOTE 5—INVENTORY
As of March 31, 2019 and December 31, 2018, inventory consisted of the following (in millions):
|
| | | | | | | | |
| | March 31, | | December 31, |
| | 2019 | | 2018 |
Natural gas | | $ | 10 |
| | $ | 28 |
|
LNG | | 25 |
| | 6 |
|
Materials and other | | 74 |
| | 65 |
|
Total inventory | | $ | 109 |
| | $ | 99 |
|
CHENIERE ENERGY PARTNERS, L.P. AND SUBSIDIARIES
NOTES TO CONSOLIDATED FINANCIAL STATEMENTS—CONTINUED
(unaudited)
NOTE 6—PROPERTY, PLANT AND EQUIPMENT
As of March 31, 2019 and December 31, 2018, property, plant and equipment, net consisted of the following (in millions):
|
| | | | | | | | |
| | March 31, | | December 31, |
| | 2019 | | 2018 |
LNG terminal costs | | | | |
LNG terminal and interconnecting pipeline facilities | | $ | 16,747 |
| | $ | 12,760 |
|
LNG terminal construction-in-process | | 263 |
| | 3,913 |
|
Accumulated depreciation | | (1,402 | ) | | (1,290 | ) |
Total LNG terminal costs, net | | 15,608 |
| | 15,383 |
|
Fixed assets | | |
| | |
|
Fixed assets | | 27 |
| | 26 |
|
Accumulated depreciation | | (20 | ) | | (19 | ) |
Total fixed assets, net | | 7 |
| | 7 |
|
Property, plant and equipment, net | | $ | 15,615 |
| | $ | 15,390 |
|
Depreciation expense was $113 million and $102 million during the three months ended March 31, 2019 and 2018, respectively.
We realized offsets to LNG terminal costs of $48 million in the three months ended March 31, 2019 that were related to the sale of commissioning cargoes because these amounts were earned or loaded prior to the start of commercial operations of Train 5 of the Liquefaction Project, during the testing phase for its construction. We did not realize any offsets to LNG terminal costs in the three months ended March 31, 2018.
NOTE 7—DERIVATIVE INSTRUMENTS
We have entered into the following derivative instruments that are reported at fair value:
| |
• | interest rate swaps to hedge the exposure to volatility in a portion of the floating-rate interest payments under certain credit facilities (“Interest Rate Derivatives”) and |
| |
• | commodity derivatives consisting of natural gas supply contracts for the commissioning and operation of the Liquefaction Project (“Physical Liquefaction Supply Derivatives”) and associated economic hedges (collectively, the “Liquefaction Supply Derivatives”). |
We recognize our derivative instruments as either assets or liabilities and measure those instruments at fair value. None of our derivative instruments are designated as cash flow hedging instruments, and changes in fair value are recorded within our Consolidated Statements of Income to the extent not utilized for the commissioning process.
The following table shows the fair value of our derivative instruments that are required to be measured at fair value on a recurring basis as of March 31, 2019 and December 31, 2018, which are classified as other current assets, non-current derivative assets, derivative liabilities or non-current derivative liabilities in our Consolidated Balance Sheets (in millions).
|
| | | | | | | | | | | | | | | | | | | | | | | | | | | | | | | |
| Fair Value Measurements as of |
| March 31, 2019 | | December 31, 2018 |
| Quoted Prices in Active Markets (Level 1) | | Significant Other Observable Inputs (Level 2) | | Significant Unobservable Inputs (Level 3) | | Total | | Quoted Prices in Active Markets (Level 1) | | Significant Other Observable Inputs (Level 2) | | Significant Unobservable Inputs (Level 3) | | Total |
Liquefaction Supply Derivatives asset (liability) | $ | 2 |
| | $ | (2 | ) | | $ | 29 |
| | $ | 29 |
| | $ | 5 |
| | $ | (23 | ) | | $ | (25 | ) | | $ | (43 | ) |
There have been no changes to our evaluation of and accounting for our derivative positions during the three months ended March 31, 2019. See Note 8—Derivative Instruments of our Notes to Consolidated Financial Statements in our annual report on Form 10-K for the year ended December 31, 2018 for additional information.
CHENIERE ENERGY PARTNERS, L.P. AND SUBSIDIARIES
NOTES TO CONSOLIDATED FINANCIAL STATEMENTS—CONTINUED
(unaudited)
We value our Interest Rate Derivatives using an income-based approach, utilizing observable inputs to the valuation model including interest rate curves, risk adjusted discount rates, credit spreads and other relevant data. We value our Liquefaction Supply Derivatives using a market-based approach incorporating present value techniques, as needed, using observable commodity price curves, when available, and other relevant data.
The fair value of our Physical Liquefaction Supply Derivatives is predominantly driven by market commodity basis prices and our assessment of the associated conditions precedent, including evaluating whether the respective market is available as pipeline infrastructure is developed. Upon the satisfaction of conditions precedent, including completion and placement into service of relevant pipeline infrastructure to accommodate marketable physical gas flow, we recognize a gain or loss based on the fair value of the respective natural gas supply contracts.
We include a portion of our Physical Liquefaction Supply Derivatives as Level 3 within the valuation hierarchy as the fair value is developed through the use of internal models which may be impacted by inputs that are unobservable in the marketplace. The curves used to generate the fair value of our Physical Liquefaction Supply Derivatives are based on basis adjustments applied to forward curves for a liquid trading point. In addition, there may be observable liquid market basis information in the near term, but terms of a Physical Liquefaction Supply Derivatives contract may exceed the period for which such information is available, resulting in a Level 3 classification. In these instances, the fair value of the contract incorporates extrapolation assumptions made in the determination of the market basis price for future delivery periods in which applicable commodity basis prices were either not observable or lacked corroborative market data.
The Level 3 fair value measurements of natural gas positions within our Physical Liquefaction Supply Derivatives could be materially impacted by a significant change in certain natural gas market basis spreads due to the contractual notional amount represented by our Level 3 positions, which is a substantial portion of our overall Physical Liquefaction Supply Derivatives portfolio. The following table includes quantitative information for the unobservable inputs for our Level 3 Physical Liquefaction Supply Derivatives as of March 31, 2019:
|
| | | | | | | | |
| | Net Fair Value Asset (in millions) | | Valuation Approach | | Significant Unobservable Input | | Significant Unobservable Inputs Range |
Physical Liquefaction Supply Derivatives | | $29 | | Market approach incorporating present value techniques | | Basis Spread | | $(0.350) - $0.082 |
The following table shows the changes in the fair value of our Level 3 Physical Liquefaction Supply Derivatives during the three months ended March 31, 2019 and 2018 (in millions):
|
| | | | | | | | |
| | Three Months Ended March 31, |
| | 2019 | | 2018 |
Balance, beginning of period | | $ | (25 | ) | | $ | 43 |
|
Realized and mark-to-market gains (losses): | | | | |
Included in cost of sales | | 9 |
| | (13 | ) |
Purchases and settlements: | | | | |
Purchases | | — |
| | 3 |
|
Settlements | | 45 |
| | (23 | ) |
Balance, end of period | | $ | 29 |
| | $ | 10 |
|
Change in unrealized gains (losses) relating to instruments still held at end of period | | $ | 9 |
| | $ | (13 | ) |
Derivative assets and liabilities arising from our derivative contracts with the same counterparty are reported on a net basis, as all counterparty derivative contracts provide for net settlement. The use of derivative instruments exposes us to counterparty credit risk, or the risk that a counterparty will be unable to meet its commitments in instances when our derivative instruments are in an asset position. Additionally, we evaluate our own ability to meet our commitments in instances where our derivative instruments are in a liability position. Our derivative instruments are subject to contractual provisions which provide for the unconditional right of set-off for all derivative assets and liabilities with a given counterparty in the event of default.
CHENIERE ENERGY PARTNERS, L.P. AND SUBSIDIARIES
NOTES TO CONSOLIDATED FINANCIAL STATEMENTS—CONTINUED
(unaudited)
Interest Rate Derivatives
We previously had interest rate swaps (“CQP Interest Rate Derivatives”) to hedge a portion of the variable interest payments on the CQP Credit Facilities, which were terminated in October 2018.
The following table shows the changes in the fair value and settlements of our Interest Rate Derivatives recorded in derivative gain, net on our Consolidated Statements of Income during the three months ended March 31, 2019 and 2018 (in millions):
|
| | | | | | | | |
| | Three Months Ended March 31, |
| | 2019 | | 2018 |
CQP Interest Rate Derivatives gain | | $ | — |
| | $ | 8 |
|
Liquefaction Supply Derivatives
SPL has entered into primarily index-based physical natural gas supply contracts and associated economic hedges to purchase natural gas for the commissioning and operation of the Liquefaction Project. The terms of the physical natural gas supply contracts range up to five years, some of which commence upon the satisfaction of certain conditions precedent.
SPL had secured up to approximately 3,542 TBtu and 3,464 TBtu of natural gas feedstock through natural gas supply contracts as of March 31, 2019 and December 31, 2018, respectively. The notional natural gas position of our Liquefaction Supply Derivatives was approximately 3,087 TBtu and 2,978 TBtu as of March 31, 2019 and December 31, 2018, respectively.
The following table shows the fair value and location of our Liquefaction Supply Derivatives on our Consolidated Balance Sheets (in millions):
|
| | | | | | | | |
| | Fair Value Measurements as of (1) |
Consolidated Balance Sheet Location | | March 31, 2019 | | December 31, 2018 |
Other current assets | | $ | 13 |
| | $ | 6 |
|
Non-current derivative assets | | 36 |
| | 31 |
|
Total derivative assets | | 49 |
| | 37 |
|
| | | | |
Derivative liabilities | | (10 | ) | | (66 | ) |
Non-current derivative liabilities | | (10 | ) | | (14 | ) |
Total derivative liabilities | | (20 | ) | | (80 | ) |
| | | | |
Derivative asset (liability), net | | $ | 29 |
| | $ | (43 | ) |
| |
(1) | $1 million for such contracts, which are included in other current assets in our Consolidated Balance Sheets as of both March 31, 2019 and December 31, 2018. |
The following table shows the changes in the fair value, settlements and location of our Liquefaction Supply Derivatives on our Consolidated Statements of Income during the three months ended March 31, 2019 and 2018 (in millions):
|
| | | | | | | | | |
| | | Three Months Ended March 31, |
| Statement of Income Location (1) | | 2019 | | 2018 |
Liquefaction Supply Derivatives gain | LNG revenues | | $ | 1 |
| | $ | — |
|
Liquefaction Supply Derivatives gain (loss) | Cost of sales | | 76 |
| | (50 | ) |
CHENIERE ENERGY PARTNERS, L.P. AND SUBSIDIARIES
NOTES TO CONSOLIDATED FINANCIAL STATEMENTS—CONTINUED
(unaudited)
Consolidated Balance Sheet Presentation
Our derivative instruments are presented on a net basis on our Consolidated Balance Sheets as described above. The following table shows the fair value of our derivatives outstanding on a gross and net basis (in millions):
|
| | | | | | | | | | | | |
| | Gross Amounts Recognized | | Gross Amounts Offset in the Consolidated Balance Sheets | | Net Amounts Presented in the Consolidated Balance Sheets |
Offsetting Derivative Assets (Liabilities) | | | |
As of March 31, 2019 | | | | | | |
Liquefaction Supply Derivatives | | $ | 51 |
| | $ | (2 | ) | | $ | 49 |
|
Liquefaction Supply Derivatives | | (22 | ) | | 2 |
| | (20 | ) |
As of December 31, 2018 | | | | | | |
Liquefaction Supply Derivatives | | $ | 63 |
| | $ | (26 | ) | | $ | 37 |
|
Liquefaction Supply Derivatives | | (92 | ) | | 12 |
| | (80 | ) |
NOTE 8—OTHER NON-CURRENT ASSETS
As of March 31, 2019 and December 31, 2018, other non-current assets, net consisted of the following (in millions):
|
| | | | | | | | |
| | March 31, | | December 31, |
| | 2019 | | 2018 |
Advances made to municipalities for water system enhancements | | $ | 90 |
| | $ | 90 |
|
Advances and other asset conveyances to third parties to support LNG terminals | | 36 |
| | 36 |
|
Tax-related payments and receivables | | 17 |
| | 17 |
|
Information technology service assets | | 10 |
| | 20 |
|
Advances made under EPC and non-EPC contracts | | 1 |
| | 14 |
|
Other | | 6 |
| | 7 |
|
Total other non-current assets, net | | $ | 160 |
| | $ | 184 |
|
NOTE 9—ACCRUED LIABILITIES
As of March 31, 2019 and December 31, 2018, accrued liabilities consisted of the following (in millions):
|
| | | | | | | | |
| | March 31, | | December 31, |
| | 2019 | | 2018 |
Interest costs and related debt fees | | $ | 217 |
| | $ | 224 |
|
Accrued natural gas purchases | | 325 |
| | 518 |
|
LNG terminal and related pipeline costs | | 175 |
| | 79 |
|
Other accrued liabilities | | 8 |
| | — |
|
Total accrued liabilities | | $ | 725 |
| | $ | 821 |
|
CHENIERE ENERGY PARTNERS, L.P. AND SUBSIDIARIES
NOTES TO CONSOLIDATED FINANCIAL STATEMENTS—CONTINUED
(unaudited)
NOTE 10—DEBT
As of March 31, 2019 and December 31, 2018, our debt consisted of the following (in millions):
|
| | | | | | | | |
| | March 31, | | December 31, |
| | 2019 | | 2018 |
Long-term debt: | | | | |
SPL | | | | |
5.625% Senior Secured Notes due 2021 (“2021 SPL Senior Notes”) | | $ | 2,000 |
| | $ | 2,000 |
|
6.25% Senior Secured Notes due 2022 (“2022 SPL Senior Notes”) | | 1,000 |
| | 1,000 |
|
5.625% Senior Secured Notes due 2023 (“2023 SPL Senior Notes”) | | 1,500 |
| | 1,500 |
|
5.75% Senior Secured Notes due 2024 (“2024 SPL Senior Notes”) | | 2,000 |
| | 2,000 |
|
5.625% Senior Secured Notes due 2025 (“2025 SPL Senior Notes”) | | 2,000 |
| | 2,000 |
|
5.875% Senior Secured Notes due 2026 (“2026 SPL Senior Notes”) | | 1,500 |
| | 1,500 |
|
5.00% Senior Secured Notes due 2027 (“2027 SPL Senior Notes”) | | 1,500 |
| | 1,500 |
|
4.200% Senior Secured Notes due 2028 (“2028 SPL Senior Notes”) | | 1,350 |
| | 1,350 |
|
5.00% Senior Secured Notes due 2037 (“2037 SPL Senior Notes”) | | 800 |
| | 800 |
|
Cheniere Partners | | | | |
5.250% Senior Notes due 2025 (“2025 CQP Senior Notes”) | | 1,500 |
| | 1,500 |
|
5.625% Senior Notes due 2026 (“2026 CQP Senior Notes”) | | 1,100 |
| | 1,100 |
|
CQP Credit Facilities | | — |
| | — |
|
Unamortized premium, discount and debt issuance costs, net | | (177 | ) | | (184 | ) |
Total long-term debt, net | | 16,073 |
| | 16,066 |
|
| | | | |
Current debt: | | | | |
$1.2 billion SPL Working Capital Facility (“SPL Working Capital Facility”) | | — |
| | — |
|
| | | | |
Total debt, net | | $ | 16,073 |
| | $ | 16,066 |
|
Credit Facilities
Below is a summary of our credit facilities outstanding as of March 31, 2019 (in millions):
|
| | | | | | | | |
| | SPL Working Capital Facility | | CQP Credit Facilities |
Original facility size | | $ | 1,200 |
| | $ | 2,800 |
|
Less: | | | | |
Outstanding balance | | — |
| | — |
|
Commitments prepaid or terminated | | — |
| | 2,685 |
|
Letters of credit issued | | 421 |
| | — |
|
Available commitment | | $ | 779 |
|
| $ | 115 |
|
| | | | |
Interest rate | | LIBOR plus 1.75% or base rate plus 0.75% | | LIBOR plus 2.25% or base rate plus 1.25%, with 0.50% step-up as of February 25, 2019 |
Maturity date | | December 31, 2020 | | February 25, 2020 |
Restrictive Debt Covenants
As of March 31, 2019, we and SPL were in compliance with all covenants related to our respective debt agreements.
CHENIERE ENERGY PARTNERS, L.P. AND SUBSIDIARIES
NOTES TO CONSOLIDATED FINANCIAL STATEMENTS—CONTINUED
(unaudited)
Interest Expense
Total interest expense consisted of the following (in millions):
|
| | | | | | | | |
| | Three Months Ended March 31, |
| | 2019 | | 2018 |
Total interest cost | | $ | 235 |
| | $ | 232 |
|
Capitalized interest | | (48 | ) | | (47 | ) |
Total interest expense, net | | $ | 187 |
| | $ | 185 |
|
Fair Value Disclosures
The following table shows the carrying amount, which is net of unamortized premium, discount and debt issuance costs, and estimated fair value of our debt (in millions):
|
| | | | | | | | | | | | | | | | |
| | March 31, 2019 | | December 31, 2018 |
| | Carrying Amount | | Estimated Fair Value | | Carrying Amount | | Estimated Fair Value |
Senior notes (1) | | $ | 15,282 |
| | $ | 16,418 |
| | $ | 15,275 |
| | $ | 15,672 |
|
2037 SPL Senior Notes (2) | | 791 |
| | 858 |
| | 791 |
| | 817 |
|
| |
(1) | 2021 SPL Senior Notes, 2022 SPL Senior Notes, 2023 SPL Senior Notes, 2024 SPL Senior Notes, 2025 SPL Senior Notes, 2026 SPL Senior Notes, 2027 SPL Senior Notes, 2028 SPL Senior Notes, 2025 CQP Senior Notes and 2026 CQP Senior Notes. The Level 2 estimated fair value was based on quotes obtained from broker-dealers or market makers of these senior notes and other similar instruments. |
NOTE 11—LEASES
Our leased assets consist primarily of tug vessels and land sites, all of which are classified as operating leases.
ASC 842 requires a lessee to recognize leases on its balance sheet by recording a lease liability representing the obligation to make future lease payments and a right-of-use asset representing the right to use the underlying asset for the lease term. As our leases generally do not provide an implicit rate, in order to calculate the lease liability, we discounted our expected future lease payments using our relevant subsidiary’s incremental borrowing rate at the later of January 1, 2019 or the commencement date of the lease. The incremental borrowing rate is an estimate of the rate of interest that a given subsidiary would have to pay to borrow on a collateralized basis over a similar term to that of the lease term.
Many of our leases contain renewal options exercisable at our sole discretion. Options to renew a lease are included in the lease term and recognized as part of the right-of-use asset and lease liability only to the extent they are reasonably certain to be exercised, such as when necessary to satisfy obligations that existed at the execution of the lease or when the non-renewal would otherwise result in an economic penalty.
We have elected the practical expedient to omit leases with an initial term of 12 months or less (“short-term lease”) from recognition on the balance sheet. We recognize short-term lease payments on a straight-line basis over the lease term and variable payments under short-term leases in the period in which the obligation is incurred.
Certain of our leases contain non-lease components which are not separated from the lease components when calculating the right-of-use asset and lease liability per our use of the practical expedient to combine both components of an arrangement for all classes of leased assets.
CHENIERE ENERGY PARTNERS, L.P. AND SUBSIDIARIES
NOTES TO CONSOLIDATED FINANCIAL STATEMENTS—CONTINUED
(unaudited)
Certain of our leases also contain variable payments, such as inflation, that are not included when calculating the right-of-use asset and lease liability unless the payments are in-substance fixed. We recognize lease expense for operating leases on a straight-line basis over the lease term.
The following table shows the classification and location of our right-of-use assets and lease liabilities on our Consolidated Balance Sheets (in millions):
|
| | | | | |
| Consolidated Balance Sheet Location | | March 31, 2019 |
Right-of-use assets—Operating | Operating lease assets, net | | $ | 93 |
|
Current operating lease liabilities | Current operating lease liabilities | | 5 |
|
Non-current operating lease liabilities | Non-current operating lease liabilities | | 87 |
|
The following table shows the classification and location of our lease cost on our Consolidated Statements of Income (in millions):
|
| | | | | |
| Consolidated Statement of Income Location | | Three Months Ended March 31, 2019 |
Operating lease cost (1) | Operating costs and expenses (2) | | $ | 2 |
|
Future annual minimum lease payments for operating leases as of March 31, 2019 are as follows (in millions):
|
| | | |
Years Ending December 31, | Operating Leases |
2019 | $ | 7 |
|
2020 | 10 |
|
2021 | 10 |
|
2022 | 10 |
|
2023 | 10 |
|
Thereafter | 124 |
|
Total lease payments | 171 |
|
Less: Interest | (80 | ) |
Present value of lease liabilities | $ | 91 |
|
Future annual minimum lease payments for operating leases as of December 31, 2018, prepared in accordance with accounting standards prior to the adoption of ASC 842, were as follows (in millions):
|
| | | |
Years Ending December 31, | Operating Leases (1) |
2019 | $ | 10 |
|
2020 | 10 |
|
2021 | 10 |
|
2022 | 10 |
|
2023 | 10 |
|
Thereafter | 124 |
|
Total | $ | 174 |
|
| |
(1) | and payments for certain non-lease components. |
CHENIERE ENERGY PARTNERS, L.P. AND SUBSIDIARIES
NOTES TO CONSOLIDATED FINANCIAL STATEMENTS—CONTINUED
(unaudited)
The following table shows the weighted-average remaining lease term (in years) and the weighted-average discount rate for our operating leases:
|
| | |
| March 31, 2019 |
Weighted-average remaining lease term (in years) | 26.3 |
|
Weighted-average discount rate | 4.8 | % |
The following table includes other quantitative information for our operating leases (in millions):
|
| | | |
| Three Months Ended March 31, 2019 |
Cash paid for amounts included in the measurement of lease liabilities: | |
Operating cash flows for operating leases | $ | 2 |
|
NOTE 12—REVENUES FROM CONTRACTS WITH CUSTOMERS
The following table represents a disaggregation of revenue earned from contracts with customers during the three months ended March 31, 2019 and 2018 (in millions):
|
| | | | | | | | |
| | Three Months Ended March 31, |
| | 2019 | | 2018 |
LNG revenues | | $ | 1,366 |
| | $ | 1,015 |
|
LNG revenues—affiliate | | 305 |
| | 503 |
|
Regasification revenues | | 66 |
| | 65 |
|
Other revenues | | 11 |
| | 10 |
|
Total revenues from customers | | 1,748 |
| | 1,593 |
|
Gains from derivative instruments | | 1 |
| | — |
|
Total revenues | | $ | 1,749 |
| | $ | 1,593 |
|
Deferred Revenue Reconciliation
The following table reflects the changes in our contract liabilities, which we classify as deferred revenue on our Consolidated Balance Sheets (in millions):
|
| | | | |
| | Three Months Ended March 31, 2019 |
Deferred revenues, beginning of period | | $ | 116 |
|
Cash received but not yet recognized | | 106 |
|
Revenue recognized from prior period deferral | | (116 | ) |
Deferred revenues, end of period | | $ | 106 |
|
CHENIERE ENERGY PARTNERS, L.P. AND SUBSIDIARIES
NOTES TO CONSOLIDATED FINANCIAL STATEMENTS—CONTINUED
(unaudited)
Transaction Price Allocated to Future Performance Obligations
Because many of our sales contracts have long-term durations, we are contractually entitled to significant future consideration which we have not yet recognized as revenue. The following table discloses the aggregate amount of the transaction price that is allocated to performance obligations that have not yet been satisfied as of March 31, 2019 and December 31, 2018:
|
| | | | | | | | | | | | |
| | March 31, 2019 | | December 31, 2018 |
| | Unsatisfied
Transaction Price
(in billions) | | Weighted Average Recognition Timing (years) (1) | | Unsatisfied
Transaction Price
(in billions) | | Weighted Average Recognition Timing (years) (1) |
LNG revenues | | $ | 53.1 |
| | 10 | | $ | 53.6 |
| | 10 |
Regasification revenues | | 2.6 |
| | 6 | | 2.6 |
| | 6 |
Total revenues | | $ | 55.7 |
| | | | $ | 56.2 |
| | |
We have elected the following exemptions which omit certain potential future sources of revenue from the table above:
| |
(1) | We omit from the table above all performance obligations that are part of a contract that has an original expected duration of one year or less. |
| |
(2) | We omit from the table above all variable consideration that is allocated entirely to a wholly unsatisfied performance obligation or to a wholly unsatisfied promise to transfer a distinct good or service that forms part of a single performance obligation when that performance obligation qualifies as a series. The table above excludes substantially all variable consideration under our SPAs and TUAs. The amount of revenue from variable fees that is not included in the transaction price will vary based on the future prices of Henry Hub throughout the contract terms, to the extent customers elect to take delivery of their LNG, and adjustments to the consumer price index. Approximately 58% and 56% of our LNG revenues during the three months ended March 31, 2019 and 2018, respectively, and approximately 3% of our regasification revenues during each of the three months ended March 31, 2019 and 2018 were related to variable consideration received from customers. All of our LNG revenues—affiliate were related to variable consideration received from customers during each of the three months ended March 31, 2019 and 2018. |
We have entered into contracts to sell LNG that are conditioned upon one or both of the parties achieving certain milestones such as reaching a final investment decision on a certain liquefaction Train, obtaining financing or achieving substantial completion of a Train and any related facilities. These contracts are considered completed contracts for revenue recognition purposes and are included in the transaction price above when the conditions are considered probable of being met.
NOTE 13—RELATED PARTY TRANSACTIONS
Below is a summary of our related party transactions as reported on our Consolidated Statements of Income for the three months ended March 31, 2019 and 2018 (in millions):
|
| | | | | | | | |
| Three Months Ended March 31, |
| 2019 | | 2018 |
LNG revenues—affiliate |
Cheniere Marketing SPA and Cheniere Marketing Master SPA | $ | 305 |
| | $ | 503 |
|
| | | |
Operating and maintenance expense—affiliate |
Services Agreements | 29 |
| | 26 |
|
|
General and administrative expense—affiliate |
Services Agreements | 21 |
| | 18 |
|
As of March 31, 2019 and December 31, 2018, we had $113 million and $114 million, respectively, of accounts receivable—affiliate, under the agreements described below.
CHENIERE ENERGY PARTNERS, L.P. AND SUBSIDIARIES
NOTES TO CONSOLIDATED FINANCIAL STATEMENTS—CONTINUED
(unaudited)
LNG Terminal Capacity Agreements
Terminal Use Agreements
SPL obtained approximately 2.0 Bcf/d of regasification capacity and other liquefaction support services under a TUA with SPLNG as a result of an assignment in July 2012 by Cheniere Investments of its rights, title and interest under its TUA with SPLNG. SPL is obligated to make monthly capacity payments to SPLNG aggregating approximately $250 million per year (the “TUA Fees”), continuing until at least May 2036.
In connection with this TUA, SPL is required to pay for a portion of the cost (primarily LNG inventory) to maintain the cryogenic readiness of the regasification facilities at the Sabine Pass LNG terminal, which is recorded as operating and maintenance expense on our Consolidated Statements of Income.
Cheniere Investments, SPL and SPLNG entered into the terminal use rights assignment and agreement (the “TURA”) pursuant to which Cheniere Investments had the right to use SPL’s reserved capacity under the TUA and had the obligation to pay the TUA Fees required by the TUA to SPLNG. However, the revenue earned by SPLNG from the TUA Fees and the loss incurred by Cheniere Investments under the TURA are eliminated upon consolidation of our Consolidated Financial Statements. We have guaranteed the obligations of SPL under its TUA and the obligations of Cheniere Investments under the TURA.
In an effort to utilize Cheniere Investments’ reserved capacity under the TURA during construction of the Liquefaction Project, Cheniere Marketing has entered into an amended and restated variable capacity rights agreement with Cheniere Investments (the “Amended and Restated VCRA”) pursuant to which Cheniere Marketing is obligated to pay Cheniere Investments 80% of the expected gross margin of each cargo of LNG that Cheniere Marketing arranges for delivery to the Sabine Pass LNG terminal. Cheniere Investments recorded no revenues—affiliate from Cheniere Marketing during the three months ended March 31, 2019 and 2018 related to the Amended and Restated VCRA.
Cheniere Marketing SPA
Cheniere Marketing has an SPA with SPL to purchase, at Cheniere Marketing’s option, any LNG produced by SPL in excess of that required for other customers at a price of 115% of Henry Hub plus $3.00 per MMBtu of LNG.
Cheniere Marketing Master SPA
SPL has an agreement with Cheniere Marketing that allows the parties to sell and purchase LNG with each other by executing and delivering confirmations under this agreement. SPL executed a confirmation with Cheniere Marketing that obligated Cheniere Marketing in certain circumstances to buy LNG cargoes produced during the period while Bechtel Oil, Gas and Chemicals, Inc. had control of, and was commissioning, Train 5 of the Liquefaction Project.
Services Agreements
As of March 31, 2019 and December 31, 2018, we had $316 million and $228 million of advances to affiliates, respectively, under the services agreements described below. The non-reimbursement amounts incurred under these agreements are recorded in general and administrative expense—affiliate.
Cheniere Partners Services Agreement
We have a services agreement with Cheniere Terminals, a wholly owned subsidiary of Cheniere, pursuant to which Cheniere Terminals is entitled to a quarterly non-accountable overhead reimbursement charge of $3 million (adjusted for inflation) for the provision of various general and administrative services for our benefit. In addition, Cheniere Terminals is entitled to reimbursement for all audit, tax, legal and finance fees incurred by Cheniere Terminals that are necessary to perform the services under the agreement.
CHENIERE ENERGY PARTNERS, L.P. AND SUBSIDIARIES
NOTES TO CONSOLIDATED FINANCIAL STATEMENTS—CONTINUED
(unaudited)
Cheniere Investments Information Technology Services Agreement
Cheniere Investments has an information technology services agreement with Cheniere, pursuant to which Cheniere Investments’ subsidiaries receive certain information technology services. On a quarterly basis, the various entities receiving the benefit are invoiced by Cheniere Investments according to the cost allocation percentages set forth in the agreement. In addition, Cheniere is entitled to reimbursement for all costs incurred by Cheniere that are necessary to perform the services under the agreement.
SPLNG O&M Agreement
SPLNG has a long-term operation and maintenance agreement (the “SPLNG O&M Agreement”) with Cheniere Investments pursuant to which SPLNG receives all necessary services required to operate and maintain the Sabine Pass LNG receiving terminal. SPLNG pays a fixed monthly fee of $130,000 (indexed for inflation) under the SPLNG O&M Agreement and the cost of a bonus equal to 50% of the salary component of labor costs in certain circumstances to be agreed upon between SPLNG and Cheniere Investments at the beginning of each operating year. In addition, SPLNG is required to reimburse Cheniere Investments for its operating expenses, which consist primarily of labor expenses. Cheniere Investments provides the services required under the SPLNG O&M Agreement pursuant to a secondment agreement with a wholly owned subsidiary of Cheniere. All payments received by Cheniere Investments under the SPLNG O&M Agreement are required to be remitted to such subsidiary.
SPLNG MSA
SPLNG has a long-term management services agreement (the “SPLNG MSA”) with Cheniere Terminals, pursuant to which Cheniere Terminals manages the operation of the Sabine Pass LNG receiving terminal, excluding those matters provided for under the SPLNG O&M Agreement. SPLNG pays a monthly fixed fee of $520,000 (indexed for inflation) under the SPLNG MSA.
SPL O&M Agreement
SPL has an operation and maintenance agreement (the “SPL O&M Agreement”) with Cheniere Investments pursuant to which SPL receives all of the necessary services required to construct, operate and maintain the Liquefaction Project. Before each Train of the Liquefaction Project is operational, the services to be provided include, among other services, obtaining governmental approvals on behalf of SPL, preparing an operating plan for certain periods, obtaining insurance, preparing staffing plans and preparing status reports. After each Train is operational, the services include all necessary services required to operate and maintain the Train. Prior to the substantial completion of each Train of the Liquefaction Project, in addition to reimbursement of operating expenses, SPL is required to pay a monthly fee equal to 0.6% of the capital expenditures incurred in the previous month. After substantial completion of each Train, for services performed while the Train is operational, SPL will pay, in addition to the reimbursement of operating expenses, a fixed monthly fee of $83,333 (indexed for inflation) for services with respect to the Train. Cheniere Investments provides the services required under the SPL O&M Agreement pursuant to a secondment agreement with a wholly owned subsidiary of Cheniere. All payments received by Cheniere Investments under the SPL O&M Agreement are required to be remitted to such subsidiary.
SPL MSA
SPL has a management services agreement (the “SPL MSA”) with Cheniere Terminals pursuant to which Cheniere Terminals manages the construction and operation of the Liquefaction Project, excluding those matters provided for under the SPL O&M Agreement. The services include, among other services, exercising the day-to-day management of SPL’s affairs and business, managing SPL’s regulatory matters, managing bank and brokerage accounts and financial books and records of SPL’s business and operations, entering into financial derivatives on SPL’s behalf and providing contract administration services for all contracts associated with the Liquefaction Project. Prior to the substantial completion of each Train of the Liquefaction Project, SPL pays a monthly fee equal to 2.4% of the capital expenditures incurred in the previous month. After substantial completion of each Train, SPL will pay a fixed monthly fee of $541,667 (indexed for inflation) for services with respect to such Train.
CTPL O&M Agreement
CTPL has an amended long-term operation and maintenance agreement (the “CTPL O&M Agreement”) with Cheniere Investments pursuant to which CTPL receives all necessary services required to operate and maintain the Creole Trail Pipeline.
CHENIERE ENERGY PARTNERS, L.P. AND SUBSIDIARIES
NOTES TO CONSOLIDATED FINANCIAL STATEMENTS—CONTINUED
(unaudited)
CTPL is required to reimburse Cheniere Investments for its operating expenses, which consist primarily of labor expenses. Cheniere Investments provides the services required under the CTPL O&M Agreement pursuant to a secondment agreement with a wholly owned subsidiary of Cheniere. All payments received by Cheniere Investments under the CTPL O&M Agreement are required to be remitted to such subsidiary.
Agreement to Fund SPLNG’s Cooperative Endeavor Agreements
SPLNG has executed Cooperative Endeavor Agreements (“CEAs”) with various Cameron Parish, Louisiana taxing authorities that allowed them to collect certain annual property tax payments from SPLNG from 2007 through 2016. This initiative represented an aggregate commitment of $25 million over 10 years in order to aid in their reconstruction efforts following Hurricane Rita. In exchange for SPLNG’s advance payments of annual ad valorem taxes, Cameron Parish will grant SPLNG a dollar-for-dollar credit against future ad valorem taxes to be levied against the Sabine Pass LNG terminal starting in 2019. Beginning in September 2007, SPLNG entered into various agreements with Cheniere Marketing, pursuant to which Cheniere Marketing would pay SPLNG additional TUA revenues equal to any and all amounts payable by SPLNG to the Cameron Parish taxing authorities under the CEAs. In exchange for such amounts received as TUA revenues from Cheniere Marketing, SPLNG will make payments to Cheniere Marketing equal to ad valorem tax levied on our LNG terminal in the year the Cameron Parish dollar-for-dollar credit is applied.
On a consolidated basis, these advance tax payments were recorded to other non-current assets, and payments from Cheniere Marketing that SPLNG utilized to make the ad valorem tax payments were recorded as a long-term obligation. As of both March 31, 2019 and December 31, 2018, we had $3 million in due to affiliates and $22 million of other non-current liabilities—affiliate resulting from these payments received from Cheniere Marketing.
Contracts for Sale and Purchase of Natural Gas and LNG
SPLNG is able to sell and purchase natural gas and LNG under agreements with Cheniere Marketing. Under these agreements, SPLNG purchases natural gas or LNG from Cheniere Marketing at a sales price equal to the actual purchase price paid by Cheniere Marketing to suppliers of the natural gas or LNG, plus any third-party costs incurred by Cheniere Marketing with respect to the receipt, purchase and delivery of natural gas or LNG to the Sabine Pass LNG terminal.
Terminal Marine Services Agreement
In connection with its tug boat lease, Tug Services entered into an agreement with a wholly owned subsidiary of Cheniere to provide its LNG cargo vessels with tug boat and marine services at the Sabine Pass LNG terminal. The agreement also provides that Tug Services shall contingently pay the wholly owned subsidiary of Cheniere a portion of its future revenues. Accordingly, Tug Services distributed $1 million to the wholly owned subsidiary of Cheniere during each of the three months ended March 31, 2019 and 2018, which is recognized as part of the distributions to our general partner interest holders on the Consolidated Statements of Partners’ Equity.
LNG Terminal Export Agreement
SPLNG and Cheniere Marketing have an LNG terminal export agreement that provides Cheniere Marketing the ability to export LNG from the Sabine Pass LNG terminal. SPLNG did not record any revenues associated with this agreement during the three months ended March 31, 2019 and 2018.
State Tax Sharing Agreements
SPLNG has a state tax sharing agreement with Cheniere. Under this agreement, Cheniere has agreed to prepare and file all state and local tax returns which SPLNG and Cheniere are required to file on a combined basis and to timely pay the combined state and local tax liability. If Cheniere, in its sole discretion, demands payment, SPLNG will pay to Cheniere an amount equal to the state and local tax that SPLNG would be required to pay if its state and local tax liability were calculated on a separate company basis. There have been no state and local taxes paid by Cheniere for which Cheniere could have demanded payment from SPLNG under this agreement; therefore, Cheniere has not demanded any such payments from SPLNG. The agreement is effective for tax returns due on or after January 1, 2008.
CHENIERE ENERGY PARTNERS, L.P. AND SUBSIDIARIES
NOTES TO CONSOLIDATED FINANCIAL STATEMENTS—CONTINUED
(unaudited)
SPL has a state tax sharing agreement with Cheniere. Under this agreement, Cheniere has agreed to prepare and file all state and local tax returns which SPL and Cheniere are required to file on a combined basis and to timely pay the combined state and local tax liability. If Cheniere, in its sole discretion, demands payment, SPL will pay to Cheniere an amount equal to the state and local tax that SPL would be required to pay if SPL’s state and local tax liability were calculated on a separate company basis. There have been no state and local taxes paid by Cheniere for which Cheniere could have demanded payment from SPL under this agreement; therefore, Cheniere has not demanded any such payments from SPL. The agreement is effective for tax returns due on or after August 2012.
CTPL has a state tax sharing agreement with Cheniere. Under this agreement, Cheniere has agreed to prepare and file all state and local tax returns which CTPL and Cheniere are required to file on a combined basis and to timely pay the combined state and local tax liability. If Cheniere, in its sole discretion, demands payment, CTPL will pay to Cheniere an amount equal to the state and local tax that CTPL would be required to pay if CTPL’s state and local tax liability were calculated on a separate company basis. There have been no state and local taxes paid by Cheniere for which Cheniere could have demanded payment from CTPL under this agreement; therefore, Cheniere has not demanded any such payments from CTPL. The agreement is effective for tax returns due on or after May 2013.
NOTE 14—NET INCOME PER COMMON UNIT
Net income per common unit for a given period is based on the distributions that will be made to the unitholders with respect to the period plus an allocation of undistributed net income based on provisions of the partnership agreement, divided by the weighted average number of common units outstanding. Distributions paid by us are presented on the Consolidated Statements of Partners’ Equity. On April 26, 2019, we declared a $0.60 distribution per common unit and subordinated unit and the related distribution to our general partner and IDR holders to be paid on May 15, 2019 to unitholders of record as of May 7, 2019 for the period from January 1, 2019 to March 31, 2019.
The two-class method dictates that net income for a period be reduced by the amount of available cash that will be distributed with respect to that period and that any residual amount representing undistributed net income be allocated to common unitholders and other participating unitholders to the extent that each unit may share in net income as if all of the net income for the period had been distributed in accordance with the partnership agreement. Undistributed income is allocated to participating securities based on the distribution waterfall for available cash specified in the partnership agreement. Undistributed losses (including those resulting from distributions in excess of net income) are allocated to common units and other participating securities on a pro rata basis based on provisions of the partnership agreement. Distributions are treated as distributed earnings in the computation of earnings per common unit even though cash distributions are not necessarily derived from current or prior period earnings.
CHENIERE ENERGY PARTNERS, L.P. AND SUBSIDIARIES
NOTES TO CONSOLIDATED FINANCIAL STATEMENTS—CONTINUED
(unaudited)
The following table provides a reconciliation of net income and the allocation of net income to the common units, the subordinated units, the general partner units and IDRs for purposes of computing basic and diluted net income per unit (in millions, except per unit data).
|
| | | | | | | | | | | | | | | | | | | | |
| | | | Limited Partner Units | | | | |
| | Total | | Common Units | | Subordinated Units | | General Partner Units | | IDR |
| | | | | | | | | | |
Three Months Ended March 31, 2019 | | | | | | | | | | |
Net income | | $ | 385 |
| | | | | | | | |
Declared distributions | | 310 |
| | 210 |
| | 81 |
| | 6 |
| | 13 |
|
Assumed allocation of undistributed net income (1) | | $ | 75 |
| | 52 |
| | 21 |
| | 2 |
| | — |
|
Assumed allocation of net income | | | | $ | 262 |
| | $ | 102 |
| | $ | 8 |
| | $ | 13 |
|
| | | | | | | | | | |
Weighted average units outstanding | | | | 348.6 |
| | 135.4 |
| | | | |
Basic and diluted net income per unit | | | | $ | 0.75 |
| | $ | 0.75 |
| | | | |
| | | | | | | | | | |
Three Months Ended March 31, 2018 | | | | | | | | | | |
Net income | | $ | 335 |
| | | | | | | | |
Declared distributions | | 278 |
| | 192 |
| | 74 |
| | 6 |
| | 6 |
|
Assumed allocation of undistributed net income (1) | | $ | 57 |
| | 40 |
| | 16 |
| | 1 |
| | — |
|
Assumed allocation of net income | | | | $ | 232 |
| | $ | 90 |
| | $ | 7 |
| | $ | 6 |
|
| | | | | | | | | | |
Weighted average units outstanding | | | | 348.6 |
| | 135.4 |
| | | | |
Basic and diluted net income per unit (2) | | | | $ | 0.67 |
| | $ | 0.67 |
| | | | |
| |
(1) | IDRs participate in net income (loss) only to the extent of the amount of cash distributions actually declared, thereby excluding the IDRs from participating in undistributed net income (loss). |
NOTE 15—CUSTOMER CONCENTRATION
The following table shows customers with revenues of 10% or greater of total revenues from external customers and customers with accounts receivable balances of 10% or greater of total accounts receivable from external customers:
|
| | | | | | | | |
| | Percentage of Total Revenues from External Customers | | Percentage of Accounts Receivable from External Customers |
| | Three Months Ended March 31, | | March 31, | | December 31, |
| | 2019 | | 2018 | | 2019 | | 2018 |
Customer A | | 31% | | 31% | | 35% | | 35% |
Customer B | | 19% | | 25% | | 22% | | 23% |
Customer C | | 19% | | 25% | | 23% | | 30% |
Customer D | | 22% | | * | | 10% | | * |
* Less than 10%
CHENIERE ENERGY PARTNERS, L.P. AND SUBSIDIARIES
NOTES TO CONSOLIDATED FINANCIAL STATEMENTS—CONTINUED
(unaudited)
NOTE 16—SUPPLEMENTAL CASH FLOW INFORMATION
The following table provides supplemental disclosure of cash flow information (in millions):
|
| | | | | | | |
| Three Months Ended March 31, |
| 2019 | | 2018 |
Cash paid during the period for interest, net of amounts capitalized | $ | 185 |
| | $ | 242 |
|
The balance in property, plant and equipment, net funded with accounts payable and accrued liabilities (including affiliate) was $330 million and $200 million as of March 31, 2019 and 2018, respectively.
NOTE 17—SUPPLEMENTAL GUARANTOR INFORMATION
Our CQP Senior Notes are jointly and severally guaranteed by each of our subsidiaries other than SPL (the “Guarantors”) and, subject to certain conditions governing its guarantee, Sabine Pass LP (collectively with SPL, the “Non-Guarantors”). These guarantees are full and unconditional, subject to certain customary release provisions including (1) the sale, exchange, disposition or transfer (by merger, consolidation or otherwise) of the capital stock or all or substantially all of the assets of the Guarantors, (2) upon the liquidation or dissolution of a Guarantor, (3) following the release of a Guarantor from its guarantee obligations and (4) upon the legal defeasance or satisfaction and discharge of obligations under the CQP Indenture. See Note 10—Debt in this quarterly report and Note 11—Debt of our Notes to Consolidated Financial Statements in our annual report on Form 10-K for the year ended December 31, 2018 for additional information regarding the CQP Senior Notes.
The following is condensed consolidating financial information for Cheniere Partners (“Parent Issuer”), the Guarantors on a combined basis and the Non-Guarantors on a combined basis. We have accounted for investments in subsidiaries using the equity method.
CHENIERE ENERGY PARTNERS, L.P. AND SUBSIDIARIES
NOTES TO CONSOLIDATED FINANCIAL STATEMENTS—CONTINUED
(unaudited)
|
| | | | | | | | | | | | | | | | | | | |
Condensed Consolidating Balance Sheet |
March 31, 2019 |
(in millions) |
| | | | | | | | | |
| Parent Issuer | | Guarantors | | Non-Guarantors | | Eliminations | | Consolidated |
ASSETS | | | | | | | | | |
Current assets | | | | | | | | | |
Cash and cash equivalents | $ | — |
| | $ | — |
| | $ | — |
| | $ | — |
| | $ | — |
|
Restricted cash | 661 |
| | 15 |
| | 621 |
| | — |
| | 1,297 |
|
Accounts and other receivables | 1 |
| | 2 |
| | 205 |
| | — |
| | 208 |
|
Accounts receivable—affiliate | 1 |
| | 22 |
| | 112 |
| | (22 | ) | | 113 |
|
Advances to affiliate | — |
| | 130 |
| | 296 |
| | (110 | ) | | 316 |
|
Inventory | — |
| | 13 |
| | 96 |
| | — |
| | 109 |
|
Other current assets | — |
| | 4 |
| | 42 |
| | — |
| | 46 |
|
Other current assets—affiliate | — |
| | 1 |
| | 21 |
| | (21 | ) | | 1 |
|
Total current assets | 663 |
| | 187 |
| | 1,393 |
| | (153 | ) | | 2,090 |
|
| | | | | | | | | |
Property, plant and equipment, net | 79 |
| | 2,117 |
| | 13,446 |
| | (27 | ) | | 15,615 |
|
Operating lease assets, net | — |
| | 89 |
| | 20 |
| | (16 | ) | | 93 |
|
Debt issuance costs, net | 1 |
| | — |
| | 10 |
| | — |
| | 11 |
|
Non-current derivative assets | — |
| | — |
| | 36 |
| | — |
| | 36 |
|
Investments in subsidiaries | 2,779 |
| | 680 |
| | — |
| | (3,459 | ) | | — |
|
Other non-current assets, net | — |
| | 23 |
| | 137 |
| | — |
| | 160 |
|
Total assets | $ | 3,522 |
| | $ | 3,096 |
| | $ | 15,042 |
| | $ | (3,655 | ) | | $ | 18,005 |
|
| | | | | | | | | |
LIABILITIES AND PARTNERS’ EQUITY | | | | | | | | | |
Current liabilities | | | | | | | | | |
Accounts payable | $ | — |
| | $ | 5 |
| | $ | 26 |
| | $ | — |
| | $ | 31 |
|
Accrued liabilities | 74 |
| | 27 |
| | 624 |
| | — |
| | 725 |
|
Due to affiliates | — |
| | 132 |
| | 51 |
| | (132 | ) | | 51 |
|
Deferred revenue | — |
| | 22 |
| | 84 |
| | — |
| | 106 |
|
Deferred revenue—affiliate | — |
| | 21 |
| | — |
| | (21 | ) | | — |
|
Current operating lease liabilities | — |
| | 5 |
| | — |
| | — |
| | 5 |
|
Derivative liabilities | — |
| | — |
| | 10 |
| | — |
| | 10 |
|
Total current liabilities | 74 |
| | 212 |
| | 795 |
| | (153 | ) | | 928 |
|
| | | | | | | | | |
Long-term debt, net | 2,567 |
| | — |
| | 13,506 |
| | — |
| | 16,073 |
|
Non-current operating lease liabilities | — |
| | 83 |
| | 4 |
| | — |
| | 87 |
|
Non-current derivative liabilities | — |
| | — |
| | 10 |
| | — |
| | 10 |
|
Other non-current liabilities | — |
| | 1 |
| | 3 |
| | — |
| | 4 |
|
Other non-current liabilities—affiliate | — |
| | 21 |
| | 17 |
| | (16 | ) | | 22 |
|
| | | | | | | | | |
Partners’ equity | 881 |
| | 2,779 |
| | 707 |
| | (3,486 | ) | | 881 |
|
Total liabilities and partners’ equity | $ | 3,522 |
| | $ | 3,096 |
| | $ | 15,042 |
| | $ | (3,655 | ) | | $ | 18,005 |
|
CHENIERE ENERGY PARTNERS, L.P. AND SUBSIDIARIES
NOTES TO CONSOLIDATED FINANCIAL STATEMENTS—CONTINUED
(unaudited)
|
| | | | | | | | | | | | | | | | | | | |
Condensed Consolidating Balance Sheet |
December 31, 2018 |
(in millions) |
| | | | | | | | | |
| Parent Issuer | | Guarantors | | Non-Guarantors | | Eliminations | | Consolidated |
ASSETS | | | | | | | | | |
Current assets | | | | | | | | | |
Cash and cash equivalents | $ | — |
| | $ | — |
| | $ | — |
| | $ | — |
| | $ | — |
|
Restricted cash | 779 |
| | 6 |
| | 756 |
| | — |
| | 1,541 |
|
Accounts and other receivables | 1 |
| | 1 |
| | 346 |
| | — |
| | 348 |
|
Accounts receivable—affiliate | 1 |
| | 40 |
| | 113 |
| | (40 | ) | | 114 |
|
Advances to affiliate | — |
| | 104 |
| | 210 |
| | (86 | ) | | 228 |
|
Inventory | — |
| | 12 |
| | 87 |
| | — |
| | 99 |
|
Other current assets | — |
| | 2 |
| | 24 |
| | — |
| | 26 |
|
Other current assets—affiliate | — |
| | — |
| | 21 |
| | (21 | ) | | — |
|
Total current assets | 781 |
| | 165 |
| | 1,557 |
| | (147 | ) | | 2,356 |
|
| | | | | | | | | |
Property, plant and equipment, net | 79 |
| | 2,128 |
| | 13,209 |
| | (26 | ) | | 15,390 |
|
Debt issuance costs, net | 1 |
| | — |
| | 12 |
| | — |
| | 13 |
|
Non-current derivative assets | — |
| | — |
| | 31 |
| | — |
| | 31 |
|
Investments in subsidiaries | 2,544 |
| | 440 |
| | — |
| | (2,984 | ) | | — |
|
Other non-current assets, net | — |
| | 26 |
| | 158 |
| | — |
| | 184 |
|
Total assets | $ | 3,405 |
| | $ | 2,759 |
| | $ | 14,967 |
| | $ | (3,157 | ) | | $ | 17,974 |
|
| | | | | | | | | |
LIABILITIES AND PARTNERS’ EQUITY | | | | | | | | | |
Current liabilities | | | | | | | | | |
Accounts payable | $ | — |
| | $ | 4 |
| | $ | 11 |
| | $ | — |
| | $ | 15 |
|
Accrued liabilities | 39 |
| | 14 |
| | 768 |
| | — |
| | 821 |
|
Due to affiliates | — |
| | 127 |
| | 48 |
| | (126 | ) | | 49 |
|
Deferred revenue | — |
| | 25 |
| | 91 |
| | — |
| | 116 |
|
Deferred revenue—affiliate | — |
| | 22 |
| | — |
| | (21 | ) | | 1 |
|
Derivative liabilities | — |
| | — |
| | 66 |
| | — |
| | 66 |
|
Total current liabilities | 39 |
| | 192 |
| | 984 |
| | (147 | ) | | 1,068 |
|
| | | | | | | | | |
Long-term debt, net | 2,566 |
| | — |
| | 13,500 |
| | — |
| | 16,066 |
|
Non-current derivative liabilities | — |
| | — |
| | 14 |
| | — |
| | 14 |
|
Other non-current liabilities | — |
| | 1 |
| | 3 |
| | — |
| | 4 |
|
Other non-current liabilities—affiliate | — |
| | 22 |
| | — |
| | — |
| | 22 |
|
| | | | | | | | | |
Partners’ equity | 800 |
| | 2,544 |
| | 466 |
| | (3,010 | ) | | 800 |
|
Total liabilities and partners’ equity | $ | 3,405 |
| | $ | 2,759 |
| | $ | 14,967 |
| | $ | (3,157 | ) | | $ | 17,974 |
|
CHENIERE ENERGY PARTNERS, L.P. AND SUBSIDIARIES
NOTES TO CONSOLIDATED FINANCIAL STATEMENTS—CONTINUED
(unaudited)
|
| | | | | | | | | | | | | | | | | | | |
Condensed Consolidating Statement of Income |
Three Months Ended March 31, 2019 |
(in millions) |
| | | | | | | | | |
| Parent Issuer | | Guarantors | | Non-Guarantors | | Eliminations | | Consolidated |
| | | | | | | | | |
Revenues | | | | | | | | | |
LNG revenues | $ | — |
| | $ | — |
| | $ | 1,367 |
| | $ | — |
| | $ | 1,367 |
|
LNG revenues—affiliate | — |
| | — |
| | 305 |
| | — |
| | 305 |
|
Regasification revenues | — |
| | 66 |
| | — |
| | — |
| | 66 |
|
Regasification revenues—affiliate | — |
| | 66 |
| | — |
| | (66 | ) | | — |
|
Other revenues | — |
| | 11 |
| | — |
| | — |
| | 11 |
|
Other revenues—affiliate | — |
| | 59 |
| | — |
| | (59 | ) | | — |
|
Total revenues | — |
| | 202 |
| | 1,672 |
| | (125 | ) | | 1,749 |
|
| | | | | | | | | |
Operating costs and expenses | | | | | | | | | |
Cost of sales (excluding depreciation and amortization expense shown separately below) | — |
| | — |
| | 879 |
| | — |
| | 879 |
|
Cost of sales—affiliate | — |
| | — |
| | 9 |
| | (9 | ) | | — |
|
Operating and maintenance expense | — |
| | 28 |
| | 110 |
| | — |
| | 138 |
|
Operating and maintenance expense—affiliate | — |
| | 33 |
| | 107 |
| | (111 | ) | | 29 |
|
General and administrative expense | 1 |
| | 1 |
| | 1 |
| | — |
| | 3 |
|
General and administrative expense—affiliate | 3 |
| | 6 |
| | 15 |
| | (3 | ) | | 21 |
|
Depreciation and amortization expense | 1 |
| | 17 |
| | 96 |
| | — |
| | 114 |
|
Impairment expense and loss on disposal of assets | — |
| | — |
| | 2 |
| | — |
| | 2 |
|
Total operating costs and expenses | 5 |
| | 85 |
| | 1,219 |
| | (123 | ) | | 1,186 |
|
| | | | | | | | | |
Income (loss) from operations | (5 | ) | | 117 |
| | 453 |
| | (2 | ) | | 563 |
|
| | | | | | | | | |
Other income (expense) | | | | | | | | | |
Interest expense, net of capitalized interest | (36 | ) | | (1 | ) | | (150 | ) | | — |
| | (187 | ) |
Equity earnings of subsidiaries | 422 |
| | 308 |
| | — |
| | (730 | ) | | — |
|
Other income | 4 |
| | — |
| | 5 |
| | — |
| | 9 |
|
Total other income (expense) | 390 |
| | 307 |
| | (145 | ) | | (730 | ) | | (178 | ) |
| | | | | | | | | |
Net income | $ | 385 |
| | $ | 424 |
| | $ | 308 |
| | $ | (732 | ) | | $ | 385 |
|
CHENIERE ENERGY PARTNERS, L.P. AND SUBSIDIARIES
NOTES TO CONSOLIDATED FINANCIAL STATEMENTS—CONTINUED
(unaudited)
|
| | | | | | | | | | | | | | | | | | | |
Condensed Consolidating Statement of Income |
Three Months Ended March 31, 2018 |
(in millions) |
| | | | | | | | | |
| Parent Issuer | | Guarantors | | Non-Guarantors | | Eliminations | | Consolidated |
| | | | | | | | | |
Revenues | | | | | | | | | |
LNG revenues | $ | — |
| | $ | — |
| | $ | 1,015 |
| | $ | — |
| | $ | 1,015 |
|
LNG revenues—affiliate | — |
| | — |
| | 503 |
| | — |
| | 503 |
|
Regasification revenues | — |
| | 65 |
| | — |
| | — |
| | 65 |
|
Regasification revenues—affiliate | — |
| | 64 |
| | — |
| | (64 | ) | | — |
|
Other revenues | — |
| | 10 |
| | — |
| | — |
| | 10 |
|
Other revenues—affiliate | — |
| | 55 |
| | — |
| | (55 | ) | | — |
|
Total revenues | — |
| | 194 |
| | 1,518 |
| | (119 | ) | | 1,593 |
|
| | | | | | | | | |
Operating costs and expenses | | | | | | | | | |
Cost of sales (excluding depreciation and amortization expense shown separately below) | — |
| | — |
| | 838 |
| | (1 | ) | | 837 |
|
Cost of sales—affiliate | — |
| | — |
| | 8 |
| | (8 | ) | | — |
|
Operating and maintenance expense | — |
| | 17 |
| | 78 |
| | — |
| | 95 |
|
Operating and maintenance expense—affiliate | — |
| | 32 |
| | 103 |
| | (109 | ) | | 26 |
|
General and administrative expense | 1 |
| | 1 |
| | 2 |
| | — |
| | 4 |
|
General and administrative expense—affiliate | 3 |
| | 4 |
| | 12 |
| | (1 | ) | | 18 |
|
Depreciation and amortization expense | 1 |
| | 18 |
| | 86 |
| | — |
| | 105 |
|
Total operating costs and expenses | 5 |
| | 72 |
| | 1,127 |
| | (119 | ) | | 1,085 |
|
| | | | | | | | | |
Income (loss) from operations | (5 | ) | | 122 |
| | 391 |
| | — |
| | 508 |
|
| | | | | | | | | |
Other income (expense) | | | | | | | | | |
Interest expense, net of capitalized interest | (34 | ) | | — |
| | (151 | ) | | — |
| | (185 | ) |
Derivative gain, net | 8 |
| | — |
| | — |
| | — |
| | 8 |
|
Equity earnings of subsidiaries | 363 |
| | 242 |
| | — |
| | (605 | ) | | — |
|
Other income (expense) | 3 |
| | (1 | ) | | 2 |
| | — |
| | 4 |
|
Total other income (expense) | 340 |
| | 241 |
| | (149 | ) | | (605 | ) | | (173 | ) |
| | | | | | | | | |
Net income | $ | 335 |
| | $ | 363 |
| | $ | 242 |
| | $ | (605 | ) | | $ | 335 |
|
CHENIERE ENERGY PARTNERS, L.P. AND SUBSIDIARIES
NOTES TO CONSOLIDATED FINANCIAL STATEMENTS—CONTINUED
(unaudited)
|
| | | | | | | | | | | | | | | | | | | |
Condensed Consolidating Statement of Cash Flows |
Three Months Ended March 31, 2019 |
(in millions) |
| | | | | | | | | |
| Parent Issuer | | Guarantors | | Non-Guarantors | | Eliminations | | Consolidated |
Cash flows provided by operating activities | $ | 404 |
| | $ | 364 |
| | $ | 213 |
| | $ | (637 | ) | | $ | 344 |
|
| | | | | | | | | |
Cash flows from investing activities | | | | | | | | | |
Property, plant and equipment, net | — |
| | (5 | ) | | (280 | ) | | 2 |
| | (283 | ) |
Investments in subsidiaries | (218 | ) | | (164 | ) | | — |
| | 382 |
| | — |
|
Other | — |
| | — |
| | (1 | ) | | — |
| | (1 | ) |
Net cash used in investing activities | (218 | ) | | (169 | ) | | (281 | ) | | 384 |
| | (284 | ) |
| | | | | | | | | |
Cash flows from financing activities | | | | | | | | | |
Distributions to parent | — |
| | (404 | ) | | (231 | ) | | 635 |
| | — |
|
Contributions from parent | — |
| | 218 |
| | 164 |
| | (382 | ) | | — |
|
Distributions to owners | (304 | ) | | — |
| | — |
| | — |
| | (304 | ) |
Net cash used in financing activities | (304 | ) | | (186 | ) | | (67 | ) | | 253 |
| | (304 | ) |
| | | | | | | | | |
Net increase (decrease) in cash, cash equivalents and restricted cash | (118 | ) | | 9 |
| | (135 | ) | | — |
| | (244 | ) |
Cash, cash equivalents and restricted cash—beginning of period | 779 |
| | 6 |
| | 756 |
| | — |
| | 1,541 |
|
Cash, cash equivalents and restricted cash—end of period | $ | 661 |
| | $ | 15 |
| | $ | 621 |
| | $ | — |
| | $ | 1,297 |
|
Balances per Condensed Consolidating Balance Sheet:
|
| | | | | | | | | | | | | | | | | | | |
| March 31, 2019 |
| Parent Issuer | | Guarantors | | Non-Guarantors | | Eliminations | | Consolidated |
Cash and cash equivalents | $ | — |
| | $ | — |
| | $ | — |
| | $ | — |
| | $ | — |
|
Restricted cash | 661 |
| | 15 |
| | 621 |
| | — |
| | 1,297 |
|
Total cash, cash equivalents and restricted cash | $ | 661 |
| | $ | 15 |
| | $ | 621 |
| | $ | — |
| | $ | 1,297 |
|
CHENIERE ENERGY PARTNERS, L.P. AND SUBSIDIARIES
NOTES TO CONSOLIDATED FINANCIAL STATEMENTS—CONTINUED
(unaudited)
|
| | | | | | | | | | | | | | | | | | | |
Condensed Consolidating Statement of Cash Flows |
Three Months Ended March 31, 2018 |
(in millions) |
| | | | | | | | | |
| Parent Issuer | | Guarantors | | Non-Guarantors | | Eliminations | | Consolidated |
Cash flows provided by (used in) operating activities | $ | (10 | ) | | $ | 135 |
| | $ | 206 |
| | $ | — |
| | $ | 331 |
|
| | | | | | | | | |
Cash flows from investing activities | | | | | | | | | |
Property, plant and equipment, net | — |
| | (5 | ) | | (189 | ) | | — |
| | (194 | ) |
Investments in subsidiaries | (38 | ) | | — |
| | — |
| | 38 |
| | — |
|
Distributions received from affiliates, net | 167 |
| | — |
| | — |
| | (167 | ) | | — |
|
Net cash provided by (used in) investing activities | 129 |
| | (5 | ) | | (189 | ) | | (129 | ) | | (194 | ) |
| | | | | | | | | |
Cash flows from financing activities | | | | | | | | | |
Distributions to parent | — |
| | (167 | ) | | — |
| | 167 |
| | — |
|
Contributions from parent | — |
| | 38 |
| | — |
| | (38 | ) | | — |
|
Distributions to owners | (249 | ) | | — |
| | — |
| | — |
| | (249 | ) |
Net cash used in financing activities | (249 | ) | | (129 | ) | | — |
| | 129 |
| | (249 | ) |
| | | | | | | | | |
Net increase (decrease) in cash, cash equivalents and restricted cash | (130 | ) | | 1 |
| | 17 |
| | — |
| | (112 | ) |
Cash, cash equivalents and restricted cash—beginning of period | 1,033 |
| | 12 |
| | 544 |
| | — |
| | 1,589 |
|
Cash, cash equivalents and restricted cash—end of period | $ | 903 |
| | $ | 13 |
| | $ | 561 |
| | $ | — |
| | $ | 1,477 |
|
| |
ITEM 2. | MANAGEMENT’S DISCUSSION AND ANALYSIS OF FINANCIAL CONDITION AND RESULTS OF OPERATIONS |
Information Regarding Forward-Looking Statements
This quarterly report contains certain statements that are, or may be deemed to be, “forward-looking statements” within the meaning of Section 27A of the Securities Act of 1933, as amended, and Section 21E of the Securities Exchange Act of 1934, as amended (the “Exchange Act”). All statements, other than statements of historical or present facts or conditions, included herein or incorporated herein by reference are “forward-looking statements.” Included among “forward-looking statements” are, among other things:
| |
• | statements regarding our ability to pay distributions to our unitholders; |
| |
• | statements regarding our expected receipt of cash distributions from SPLNG, SPL or CTPL; |
| |
• | statements that we expect to commence or complete construction of our proposed LNG terminals, liquefaction facilities, pipeline facilities or other projects, or any expansions or portions thereof, by certain dates, or at all; |
| |
• | statements regarding future levels of domestic and international natural gas production, supply or consumption or future levels of LNG imports into or exports from North America and other countries worldwide or purchases of natural gas, regardless of the source of such information, or the transportation or other infrastructure or demand for and prices related to natural gas, LNG or other hydrocarbon products; |
| |
• | statements regarding any financing transactions or arrangements, or our ability to enter into such transactions; |
| |
• | statements relating to the construction of our Trains, including statements concerning the engagement of any EPC contractor or other contractor and the anticipated terms and provisions of any agreement with any EPC or other contractor, and anticipated costs related thereto; |
| |
• | statements regarding any SPA or other agreement to be entered into or performed substantially in the future, including any revenues anticipated to be received and the anticipated timing thereof, and statements regarding the amounts of total LNG regasification, natural gas liquefaction or storage capacities that are, or may become, subject to contracts; |
| |
• | statements regarding counterparties to our commercial contracts, construction contracts, and other contracts; |
| |
• | statements regarding our planned development and construction of additional Trains, including the financing of such Trains; |
| |
• | statements that our Trains, when completed, will have certain characteristics, including amounts of liquefaction capacities; |
| |
• | statements regarding our business strategy, our strengths, our business and operation plans or any other plans, forecasts, projections, or objectives, including anticipated revenues, capital expenditures, maintenance and operating costs and cash flows, any or all of which are subject to change; |
| |
• | statements regarding legislative, governmental, regulatory, administrative or other public body actions, approvals, requirements, permits, applications, filings, investigations, proceedings or decisions; and |
| |
• | any other statements that relate to non-historical or future information. |
All of these types of statements, other than statements of historical or present facts or conditions, are forward-looking statements. In some cases, forward-looking statements can be identified by terminology such as “may,” “will,” “could,” “should,” “achieve,” “anticipate,” “believe,” “contemplate,” “continue,” “estimate,” “expect,” “intend,” “plan,” “potential,” “predict,” “project,” “pursue,” “target,” the negative of such terms or other comparable terminology. The forward-looking statements contained in this quarterly report are largely based on our expectations, which reflect estimates and assumptions made by our management. These estimates and assumptions reflect our best judgment based on currently known market conditions and other factors. Although we believe that such estimates are reasonable, they are inherently uncertain and involve a number of risks and uncertainties beyond our control. In addition, assumptions may prove to be inaccurate. We caution that the forward-looking statements contained in this quarterly report are not guarantees of future performance and that such statements may not be realized or the forward-looking statements or events may not occur. Actual results may differ materially from those anticipated or implied in forward-looking statements as a result of a variety of factors described in this quarterly report and in the other reports and other information that we file with the SEC, including those discussed under “Risk Factors” in our annual report on Form 10-K for the
year ended December 31, 2018. All forward-looking statements attributable to us or persons acting on our behalf are expressly qualified in their entirety by these risk factors. These forward-looking statements speak only as of the date made, and other than as required by law, we undertake no obligation to update or revise any forward-looking statement or provide reasons why actual results may differ, whether as a result of new information, future events or otherwise.
Introduction
The following discussion and analysis presents management’s view of our business, financial condition and overall performance and should be read in conjunction with our Consolidated Financial Statements and the accompanying notes. This information is intended to provide investors with an understanding of our past performance, current financial condition and outlook for the future. Our discussion and analysis includes the following subjects:
| |
• | Overview of Significant Events |
| |
• | Liquidity and Capital Resources |
| |
• | Off-Balance Sheet Arrangements |
| |
• | Summary of Critical Accounting Estimates |
| |
• | Recent Accounting Standards |
Overview of Business
We are a publicly traded Delaware limited partnership formed by Cheniere. Our vision is to provide clean, secure and affordable energy to the world, while responsibly delivering a reliable, competitive and integrated source of LNG, in a safe and rewarding work environment. The liquefaction of natural gas into LNG allows it to be shipped economically from areas of the world where natural gas is abundant and inexpensive to produce to other areas where natural gas demand and infrastructure exist to economically justify the use of LNG. Through our wholly owned subsidiary, SPL, we are developing, constructing and operating natural gas liquefaction facilities (the “Liquefaction Project”) at the Sabine Pass LNG terminal located in Cameron Parish, Louisiana, on the Sabine-Neches Waterway less than four miles from the Gulf Coast. We plan to construct up to six Trains, which are in various stages of development, construction and operations. Trains 1 through 5 are operational and early works have begun for Train 6 under limited notices to proceed ahead of an anticipated positive final investment decision (“FID”). Each Train is expected to have a nominal production capacity, which is prior to adjusting for planned maintenance, production reliability, potential overdesign and debottlenecking opportunities, of approximately 4.5 mtpa of LNG per Train, and run rate adjusted nominal production capacity of approximately 4.5 to 4.9 mtpa of LNG per Train. Through our wholly owned subsidiary, SPLNG, we own and operate regasification facilities at the Sabine Pass LNG terminal, which includes pre-existing infrastructure of five LNG storage tanks with aggregate capacity of approximately 16.9 Bcfe, two marine berths that can each accommodate vessels with nominal capacity of up to 266,000 cubic meters and vaporizers with regasification capacity of approximately 4.0 Bcf/d. We also own a 94-mile pipeline that interconnects the Sabine Pass LNG terminal with a number of large interstate pipelines through our wholly owned subsidiary, CTPL.
Overview of Significant Events
Our significant accomplishments since January 1, 2019 and through the filing date of this Form 10-Q include the following:
Operational
| |
• | As of April 30, 2019, over 630 cumulative LNG cargoes have been produced, loaded and exported from the Liquefaction Project, with deliveries to 31 countries and regions worldwide. |
| |
• | In March 2019, SPL achieved substantial completion of Train 5 of the Liquefaction Project and commenced operating activities. |
Financial
| |
• | In March 2019, the date of first commercial delivery was reached under the 20-year SPA with BG Gulf Coast LNG, LLC relating to Train 4 of the Liquefaction Project. |
Liquidity and Capital Resources
The following table provides a summary of our liquidity position at March 31, 2019 and December 31, 2018 (in millions):
|
| | | | | | | |
| March 31, | | December 31, |
| 2019 | | 2018 |
Cash and cash equivalents | $ | — |
| | $ | — |
|
Restricted cash designated for the following purposes: | | | |
Liquefaction Project | 621 |
| | 756 |
|
Cash held by us and our guarantor subsidiaries | 676 |
| | 785 |
|
Available commitments under the following credit facilities: | | | |
$1.2 billion SPL Working Capital Facility (“SPL Working Capital Facility”) | 779 |
| | 775 |
|
Credit Facilities (“CQP Credit Facilities”) | 115 |
| | 115 |
|
For additional information regarding our debt agreements, see Note 10—Debt of our Notes to Consolidated Financial Statements in this quarterly report and Note 11—Debt of our Notes to Consolidated Financial Statements in our annual report on Form 10-K for the year ended December 31, 2018.
CQP Senior Notes
The existing $1.5 billion of 5.250% Senior Notes due 2025 (the “2025 CQP Senior Notes”) and $1.1 billion of 5.625% Senior Notes due 2026 (the “2026 CQP Senior Notes”) (collectively, the “CQP Senior Notes”) are jointly and severally guaranteed by each of our subsidiaries other than SPL (the “Guarantors”) and, subject to certain conditions governing its guarantee, Sabine Pass LP. The CQP Senior Notes are governed by the same base indenture (the “CQP Base Indenture”). The 2025 CQP Senior Notes are further governed by the First Supplemental Indenture (together with the CQP Base Indenture, the “2025 CQP Notes Indenture”) and the 2026 CQP Senior Notes are further governed by the Second Supplemental Indenture (together with the CQP Base Indenture, the “2026 CQP Notes Indenture”). The 2025 CQP Notes Indenture and the 2026 CQP Notes Indenture contain customary terms and events of default and certain covenants that, among other things, limit our ability and the ability of the Guarantors to incur liens and sell assets, enter into transactions with affiliates, enter into sale-leaseback transactions and consolidate, merge or sell, lease or otherwise dispose of all or substantially all of the applicable entity’s properties or assets.
At any time prior to October 1, 2020 for the 2025 CQP Senior Notes and October 1, 2021 for the 2026 CQP Senior Notes, we may redeem all or a part of the applicable CQP Senior Notes at a redemption price equal to 100% of the aggregate principal amount of the CQP Senior Notes redeemed, plus the “applicable premium” set forth in the respective indentures governing the CQP Senior Notes, plus accrued and unpaid interest, if any, to the date of redemption. In addition, at any time prior to October 1, 2020 for the 2025 CQP Senior Notes and October 1, 2021 for the 2026 CQP Senior Notes, we may redeem up to 35% of the aggregate principal amount of the CQP Senior Notes with an amount of cash not greater than the net cash proceeds from certain equity offerings at a redemption price equal to 105.250% of the aggregate principal amount of the 2025 CQP Senior Notes and 105.625% of the aggregate principal amount of the 2026 CQP Senior Notes redeemed, plus accrued and unpaid interest, if any, to the date of redemption. We also may at any time on or after October 1, 2020 through the maturity date of October 1, 2025 for the 2025 CQP Senior Notes and October 1, 2021 through the maturity date of October 1, 2026 for the 2026 CQP Senior Notes, redeem the CQP Senior Notes, in whole or in part, at the redemption prices set forth in the respective indentures governing the CQP Senior Notes,
The CQP Senior Notes are our senior obligations, ranking equally in right of payment with our other existing and future unsubordinated debt and senior to any of our future subordinated debt. After applying the proceeds from the 2026 CQP Senior Notes, the CQP Senior Notes became unsecured. In the event that the aggregate amount of our secured indebtedness and the secured indebtedness of the Guarantors (other than the CQP Senior Notes or any other series of notes issued under the CQP Base Indenture) outstanding at any one time exceeds the greater of (1) $1.5 billion and (2) 10% of net tangible assets, the CQP Senior Notes will be secured to the same extent as such obligations under the CQP Credit Facilities. The obligations under the CQP Credit Facilities are secured on a first-priority basis (subject to permitted encumbrances) with liens on (1) substantially all the existing and future tangible and intangible assets and our rights and the rights of the Guarantors and equity interests in the Guarantors
(except, in each case, for certain excluded properties set forth in the CQP Credit Facilities) and (2) substantially all of the real property of SPLNG (except for excluded properties referenced in the CQP Credit Facilities). The liens securing the CQP Senior Notes, if applicable, will be shared equally and ratably (subject to permitted liens) with the holders of other senior secured obligations, which include the CQP Credit Facilities obligations and any future additional senior secured debt obligations.
CQP Credit Facilities
In February 2016, we entered into the CQP Credit Facilities. The CQP Credit Facilities originally consisted of: (1) a $450 million CTPL tranche term loan that was used to prepay the $400 million term loan facility in February 2016, (2) an approximately $2.1 billion SPLNG tranche term loan that was used to repay and redeem in November 2016 the approximately $2.1 billion of the senior notes previously issued by SPLNG, (3) a $125 million facility that could be used to satisfy a six-month debt service reserve requirement and (4) a $115 million revolving credit facility that may be used for general business purposes. In September 2017 and September 2018, we issued the 2025 CQP Senior Notes and the 2026 CQP Senior Notes, respectively, and the net proceeds were used to prepay the outstanding term loans under the CQP Credit Facilities. As of March 31, 2019, only a $115 million revolving credit facility, which is currently undrawn, remains as part of the CQP Credit Facilities.
The CQP Credit Facilities mature on February 25, 2020. Any outstanding balance may be repaid, in whole or in part, at any time without premium or penalty, except for interest hedging and interest rate breakage costs. The CQP Credit Facilities contain conditions precedent for extensions of credit, as well as customary affirmative and negative covenants and limit our ability to make restricted payments, including distributions, to once per fiscal quarter as long as certain conditions are satisfied. Under the CQP Credit Facilities, we are required to hedge not less than 50% of the variable interest rate exposure on its projected aggregate outstanding balance, maintain a minimum debt service coverage ratio of at least 1.15x at the end of each fiscal quarter beginning March 31, 2019 and have a projected debt service coverage ratio of 1.55x in order to incur additional indebtedness to refinance a portion of the existing obligations.
The CQP Credit Facilities are unconditionally guaranteed by each of our subsidiaries other than (1) SPL and (2) certain of our subsidiaries owning other development projects, as well as certain other specified subsidiaries and members of the foregoing entities.
Sabine Pass LNG Terminal
Liquefaction Facilities
We are developing, constructing and operating the Liquefaction Project at the Sabine Pass LNG terminal adjacent to the existing regasification facilities. We have received authorization from the FERC to site, construct and operate Trains 1 through 6. We have achieved substantial completion of Trains 1, 2, 3, 4 and 5 of the Liquefaction Project and commenced operating activities in May 2016, September 2016, March 2017, October 2017 and March 2019, respectively.
The following orders have been issued by the DOE authorizing the export of domestically produced LNG by vessel from the Sabine Pass LNG terminal:
| |
• | Trains 1 through 4—FTA countries for a 30-year term, which commenced on May 15, 2016, and non-FTA countries for a 20-year term, which commenced on June 3, 2016, in an amount up to a combined total of the equivalent of 16 mtpa (approximately 803 Bcf/yr of natural gas). |
| |
• | Trains 1 through 4—FTA countries for a 25-year term and non-FTA countries for a 20-year term in an amount up to a combined total of the equivalent of approximately 203 Bcf/yr of natural gas (approximately 4 mtpa). |
| |
• | Trains 5 and 6—FTA countries and non-FTA countries for a 20-year term, in an amount up to a combined total of 503.3 Bcf/yr of natural gas (approximately 10 mtpa). |
In each case, the terms of these authorizations begin on the earlier of the date of first export thereunder or the date specified in the particular order, which ranges from five to 10 years from the date the order was issued. In addition, SPL received an order providing for a three-year makeup period with respect to each of the non-FTA orders for LNG volumes SPL was authorized but unable to export during any portion of the initial 20-year export period of such order.
In January 2018, the DOE issued orders authorizing SPL to export domestically produced LNG by vessel from the Sabine Pass LNG terminal to FTA countries and non-FTA countries over a two-year period commencing January 2018, in an aggregate
amount up to the equivalent of 600 Bcf of natural gas (however, exports under this order, when combined with exports under the orders above, may not exceed 1,509 Bcf/yr).
Customers
SPL has entered into fixed price SPAs with terms of at least 20 years (plus extension rights) with six third parties for Trains 1 through 5 of the Liquefaction Project, to make available an aggregate amount of LNG that is between approximately 80% to 95% of the expected aggregate adjusted nominal production capacity from these Trains. Under these SPAs, the customers will purchase LNG from SPL for a price consisting of a fixed fee per MMBtu of LNG (a portion of which is subject to annual adjustment for inflation) plus a variable fee per MMBtu of LNG equal to approximately 115% of Henry Hub. In certain circumstances, the customers may elect to cancel or suspend deliveries of LNG cargoes, in which case the customers would still be required to pay the fixed fee with respect to the contracted volumes that are not delivered as a result of such cancellation or suspension. We refer to the fee component that is applicable regardless of a cancellation or suspension of LNG cargo deliveries under the SPAs as the fixed fee component of the price under SPL’s SPAs. We refer to the fee component that is applicable only in connection with LNG cargo deliveries as the variable fee component of the price under SPL’s SPAs. The variable fees under SPL’s SPAs were sized at the time of entry into each SPA with the intent to cover the costs of gas purchases and transportation related to, and operating and maintenance costs to produce, the LNG to be sold under each such SPA. The SPAs and contracted volumes to be made available under the SPAs are not tied to a specific Train; however, the term of each SPA generally commences upon the date of first commercial delivery of a specified Train.
In aggregate, the annual fixed fee portion to be paid by the third-party SPA customers is approximately $2.3 billion for Trains 1 through 4 and increasing to $2.9 billion upon the date of first commercial delivery of Train 5, with the applicable fixed fees starting from the date of first commercial delivery from the applicable Train, as specified in each SPA.
In addition, Cheniere Marketing has entered into an SPA with SPL to purchase, at Cheniere Marketing’s option, any LNG produced by SPL in excess of that required for other customers.
Natural Gas Transportation, Storage and Supply
To ensure SPL is able to transport adequate natural gas feedstock to the Sabine Pass LNG terminal, it has entered into transportation precedent and other agreements to secure firm pipeline transportation capacity with CTPL and third-party pipeline companies. SPL has entered into firm storage services agreements with third parties to assist in managing variability in natural gas needs for the Liquefaction Project. SPL has also entered into enabling agreements and long-term natural gas supply contracts with third parties in order to secure natural gas feedstock for the Liquefaction Project. As of March 31, 2019, SPL had secured up to approximately 3,542 TBtu of natural gas feedstock through long-term and short-term natural gas supply contracts.
Construction
SPL entered into lump sum turnkey contracts with Bechtel Oil, Gas and Chemicals, Inc. (“Bechtel”) for the engineering, procurement and construction of Trains 1 through 6 of the Liquefaction Project, under which Bechtel charges a lump sum for all work performed and generally bears project cost risk unless certain specified events occur, in which case Bechtel may cause SPL to enter into a change order, or SPL agrees with Bechtel to a change order.
The total contract price of the EPC contract for Train 6 of the Liquefaction Project is approximately $2.5 billion, including estimated costs for an optional third marine berth.
Final Investment Decision on Train 6
SPL has issued limited notices to proceed to Bechtel for the commencement of certain engineering, procurement and site works for Train 6 of the Liquefaction Project and a schedule for completion has been established. FID and full notice to proceed for Train 6 of the Liquefaction Project will be contingent upon, among other things, entering into acceptable commercial arrangements and obtaining adequate financing to construct Train 6.
Regasification Facilities
The Sabine Pass LNG terminal has operational regasification capacity of approximately 4.0 Bcf/d and aggregate LNG storage capacity of approximately 16.9 Bcfe. Approximately 2.0 Bcf/d of the regasification capacity at the Sabine Pass LNG terminal has been reserved under two long-term third-party TUAs, under which SPLNG’s customers are required to pay fixed monthly fees, whether or not they use the LNG terminal. Each of Total Gas & Power North America, Inc. (“Total”) and Chevron U.S.A. Inc. (“Chevron”) has reserved approximately 1.0 Bcf/d of regasification capacity and is obligated to make monthly capacity payments to SPLNG aggregating approximately $125 million annually, prior to inflation adjustments, for 20 years that commenced in 2009. Total S.A. has guaranteed Total’s obligations under its TUA up to $2.5 billion, subject to certain exceptions, and Chevron Corporation has guaranteed Chevron’s obligations under its TUA up to 80% of the fees payable by Chevron.
The remaining approximately 2.0 Bcf/d of capacity has been reserved under a TUA by SPL. SPL is obligated to make monthly capacity payments to SPLNG aggregating approximately $250 million annually, prior to inflation adjustments, continuing until at least May 2036. SPL entered into a partial TUA assignment agreement with Total, whereby upon substantial completion of Train 5 of the Liquefaction Project, SPL gained access to substantially all of Total’s capacity and other services provided under Total’s TUA with SPLNG. This agreement provides SPL with additional berthing and storage capacity at the Sabine Pass LNG terminal that may be used to provide increased flexibility in managing LNG cargo loading and unloading activity, permit SPL to more flexibly manage its LNG storage capacity and accommodate the development of Train 6. Notwithstanding any arrangements between Total and SPL, payments required to be made by Total to SPLNG will continue to be made by Total to SPLNG in accordance with its TUA. During each of the three months ended March 31, 2019 and 2018, SPL recorded $7.5 million as operating and maintenance expense under this partial TUA assignment agreement.
Under each of these TUAs, SPLNG is entitled to retain 2% of the LNG delivered to the Sabine Pass LNG terminal.
Capital Resources
We currently expect that SPL’s capital resources requirements with respect to the Liquefaction Project will be financed through project debt and borrowings and cash flows under the SPAs. We believe that with the net proceeds of borrowings, available commitments under the SPL Working Capital Facility and cash flows from operations, we will have adequate financial resources available to meet our currently anticipated capital, operating and debt service requirements with respect to Trains 1 through 5 of the Liquefaction Project. SPL began generating cash flows from operations from the Liquefaction Project in May 2016, when Train 1 achieved substantial completion and initiated operating activities. Trains 2, 3, 4 and 5 subsequently achieved substantial completion in September 2016, March 2017, October 2017 and March 2019, respectively. We realized offsets to LNG terminal costs of $48 million in the three months ended March 31, 2019 that were related to the sale of commissioning cargoes because these amounts were earned or loaded prior to the start of commercial operations of Train 5 of the Liquefaction Project during the testing phase for its construction. We did not realize any offsets to LNG terminal costs in the three months ended March 31, 2018. Additionally, SPLNG generates cash flows from the TUAs, as discussed above.
The following table provides a summary of our capital resources from borrowings and available commitments for the Sabine Pass LNG Terminal, excluding equity contributions to our subsidiaries and cash flows from operations (as described in Sources and Uses of Cash), at March 31, 2019 and December 31, 2018 (in millions):
|
| | | | | | | | |
| | March 31, | | December 31, |
| | 2019 | | 2018 |
Senior notes (1) | | $ | 16,250 |
| | $ | 16,250 |
|
Credit facilities outstanding balance (2) | | — |
| | — |
|
Letters of credit issued (3) | | 421 |
| | 425 |
|
Available commitments under credit facilities (3) | | 779 |
| | 775 |
|
Total capital resources from borrowings and available commitments | | $ | 17,450 |
| | $ | 17,450 |
|
| |
(1) | Includes SPL’s 5.625% Senior Secured Notes due 2021, 6.25% Senior Secured Notes due 2022, 5.625% Senior Secured Notes due 2023, 5.75% Senior Secured Notes due 2024, 5.625% Senior Secured Notes due 2025, 5.875% Senior Secured Notes due 2026 (the “2026 SPL Senior Notes”), 5.00% Senior Secured Notes due 2027 (the “2027 SPL Senior Notes”), 4.200% Senior Secured Notes due 2028 (the “2028 SPL Senior Notes”) and 5.00% Senior Secured Notes due 2037 (the “2037 SPL Senior Notes”) (collectively, the “SPL Senior Notes”) and our 2025 CQP Senior Notes and 2026 CQP Senior Notes. |
| |
(2) | Includes outstanding balance under the SPL Working Capital Facility and CTPL and SPLNG tranche term loans outstanding under the CQP Credit Facilities. |
| |
(3) | Consists of SPL Working Capital Facility. Does not include the letters of credit issued or available commitments under the CQP Credit Facilities, which are not specifically for the Sabine Pass LNG Terminal. |
For additional information regarding our debt agreements related to the Sabine Pass LNG Terminal, see Note 10—Debt of our Notes to Consolidated Financial Statements in this quarterly report and Note 11—Debt of our Notes to Consolidated Financial Statements in our annual report on Form 10-K for the year ended December 31, 2018.
SPL Senior Notes
The SPL Senior Notes are secured on a pari passu first-priority basis by a security interest in all of the membership interests in SPL and substantially all of SPL’s assets.
At any time prior to three months before the respective dates of maturity for each series of the SPL Senior Notes (except for the 2026 SPL Senior Notes, 2027 SPL Senior Notes, 2028 SPL Senior Notes and 2037 SPL Senior Notes, in which case the time period is six months before the respective dates of maturity), SPL may redeem all or part of such series of the SPL Senior Notes at a redemption price equal to the “make-whole” price (except for the 2037 SPL Senior Notes, in which case the redemption price is equal to the “optional redemption” price) set forth in the respective indentures governing the SPL Senior Notes, plus accrued and unpaid interest, if any, to the date of redemption. SPL may also, at any time within three months of the respective maturity dates for each series of the SPL Senior Notes (except for the 2026 SPL Senior Notes, 2027 SPL Senior Notes, 2028 SPL Senior Notes and 2037 SPL Senior Notes, in which case the time period is within six months of the respective dates of maturity), redeem all or part of such series of the SPL Senior Notes at a redemption price equal to 100% of the principal amount of such series of the SPL Senior Notes to be redeemed, plus accrued and unpaid interest, if any, to the date of redemption.
Both the indenture governing the 2037 SPL Senior Notes (the “2037 SPL Senior Notes Indenture”) and the common indenture governing the remainder of the SPL Senior Notes (the “SPL Indenture”) include restrictive covenants. SPL may incur additional indebtedness in the future, including by issuing additional notes, and such indebtedness could be at higher interest rates and have different maturity dates and more restrictive covenants than the current outstanding indebtedness of SPL, including the SPL Senior Notes and the SPL Working Capital Facility. Under the 2037 SPL Senior Notes Indenture and the SPL Indenture, SPL may not make any distributions until, among other requirements, deposits are made into debt service reserve accounts as required and a debt service coverage ratio test of 1.25:1.00 is satisfied. Semi-annual principal payments for the 2037 SPL Senior Notes are due on March 15 and September 15 of each year beginning September 15, 2025.
SPL Working Capital Facility
In September 2015, SPL entered into the SPL Working Capital Facility, which is intended to be used for loans to SPL (“Working Capital Loans”), the issuance of letters of credit on behalf of SPL, as well as for swing line loans to SPL (“Swing Line Loans”), primarily for certain working capital requirements related to developing and placing into operation the Liquefaction Project. SPL may, from time to time, request increases in the commitments under the SPL Working Capital Facility of up to $760 million and, upon the completion of the debt financing of Train 6 of the Liquefaction Project, request an incremental increase in commitments of up to an additional $390 million. As of March 31, 2019 and December 31, 2018, SPL had $779 million and $775 million of available commitments and $421 million and $425 million aggregate amount of issued letters of credit under the SPL Working Capital Facility, respectively. SPL did not have any amounts outstanding under the SPL Working Capital Facility as of both March 31, 2019 and December 31, 2018.
The SPL Working Capital Facility matures on December 31, 2020, and the outstanding balance may be repaid, in whole or in part, at any time without premium or penalty upon three business days’ notice. Loans deemed made in connection with a draw upon a letter of credit have a term of up to one year. Swing Line Loans terminate upon the earliest of (1) the maturity date or earlier termination of the SPL Working Capital Facility, (2) the date 15 days after such Swing Line Loan is made and (3) the first borrowing date for a Working Capital Loan or Swing Line Loan occurring at least three business days following the date the Swing Line Loan is made. SPL is required to reduce the aggregate outstanding principal amount of all Working Capital Loans to zero for a period of five consecutive business days at least once each year.
The SPL Working Capital Facility contains conditions precedent for extensions of credit, as well as customary affirmative and negative covenants. The obligations of SPL under the SPL Working Capital Facility are secured by substantially all of the assets of SPL as well as all of the membership interests in SPL on a pari passu basis with the SPL Senior Notes.
Restrictive Debt Covenants
As of March 31, 2019, we and SPL were in compliance with all covenants related to our respective debt agreements.
Sources and Uses of Cash
The following table summarizes the sources and uses of our cash, cash equivalents and restricted cash for the three months ended March 31, 2019 and 2018 (in millions). The table presents capital expenditures on a cash basis; therefore, these amounts differ from the amounts of capital expenditures, including accruals, which are referred to elsewhere in this report. Additional discussion of these items follows the table.
|
| | | | | | | |
| Three Months Ended March 31, |
| 2019 | | 2018 |
Operating cash flows | $ | 344 |
| | $ | 331 |
|
Investing cash flows | (284 | ) | | (194 | ) |
Financing cash flows | (304 | ) | | (249 | ) |
| | | |
Net decrease in cash, cash equivalents and restricted cash | (244 | ) |
| (112 | ) |
Cash, cash equivalents and restricted cash—beginning of period | 1,541 |
| | 1,589 |
|
Cash, cash equivalents and restricted cash—end of period | $ | 1,297 |
| | $ | 1,477 |
|
Operating Cash Flows
Our operating cash net inflows during the three months ended March 31, 2019 and 2018 were $344 million and $331 million, respectively. The $13 million increase in operating cash inflows in 2019 compared to 2018 was primarily related to increased cash receipts from the sale of LNG cargoes, partially offset by increased operating costs and expenses as a result of an additional Train that was operating at the Liquefaction Project in 2019. In addition to Trains 1 through 4 of the Liquefaction Project that were operational during both the three months ended March 31, 2019 and 2018, Train 5 was operational for approximately a month during the three months ended March 31, 2019.
Investing Cash Flows
Investing cash net outflows during the three months ended March 31, 2019 and 2018 were $284 million and $194 million, respectively, and were primarily used to fund the construction costs for the Liquefaction Project. These costs are capitalized as construction-in-process until achievement of substantial completion.
Financing Cash Flows
Financing cash net outflows during the three months ended March 31, 2019 and 2018 were a result of $304 million and $249 million, respectively, of distributions to unitholders.
Cash Distributions to Unitholders
Our partnership agreement requires that, within 45 days after the end of each quarter, we distribute all of our available cash (as defined in our partnership agreement). Our available cash is our cash on hand at the end of a quarter less the amount of any reserves established by our general partner. All distributions paid to date have been made from accumulated operating surplus. The following provides a summary of distributions paid by us during the three months ended March 31, 2019 and 2018:
|
| | | | | | | | | | | | | | | | | | | | | | | | | | |
| | | | | | | | Total Distribution (in millions) |
Date Paid | | Period Covered by Distribution | | Distribution Per Common Unit | | Distribution Per Subordinated Unit | | Common Units | | Subordinated Units | | General Partner Units | | Incentive Distribution Rights |
February 14, 2019 | | October 1 - December 31, 2018 | | $ | 0.59 |
| | $ | 0.59 |
| | $ | 206 |
| | $ | 80 |
| | $ | 6 |
| | $ | 12 |
|
February 14, 2018 | | October 1 - December 31, 2017 | | 0.50 |
| | 0.50 |
| | 174 |
| | 68 |
| | 5 |
| | 1 |
|
On April 26, 2019, we declared a $0.60 distribution per common unit and subordinated unit and the related distribution to our general partner and incentive distribution right holders to be paid on May 15, 2019 to unitholders of record as of May 7, 2019 for the period from January 1, 2019 to March 31, 2019.
The subordinated units will receive distributions only to the extent we have available cash above the initial quarterly distributions requirement for our common unitholders and general partner along with certain reserves. Such available cash could be generated through new business development or fees received from Cheniere Marketing under an amended and restated variable capacity rights agreement pursuant to which Cheniere Marketing is obligated to pay Cheniere Investments 80% of the expected gross margin of each cargo of LNG that Cheniere Marketing arranges for delivery to the Sabine Pass LNG terminal. The ending of the subordination period and conversion of the subordinated units into common units will depend upon future business development.
Results of Operations
Our consolidated net income was $385 million, or $0.75 per common unit (basic and diluted), in the three months ended March 31, 2019, compared to $335 million, or $0.67 per common unit (basic and diluted), in the three months ended March 31, 2018. This $50 million increase in net income was primarily a result of increased income from operations due to an additional Train partially operating in the three months ended March 31, 2019 following substantial completion of Train 5 of the Liquefaction Project in March 2019.
Revenues
|
| | | | | | | | | | | | |
| | Three Months Ended March 31, |
(in millions, except volumes) | | 2019 | | 2018 | | Change |
LNG revenues | | $ | 1,367 |
| | $ | 1,015 |
| | $ | 352 |
|
LNG revenues—affiliate | | 305 |
| | 503 |
| | (198 | ) |
Regasification revenues | | 66 |
| | 65 |
| | 1 |
|
Other revenues | | 11 |
| | 10 |
| | 1 |
|
Total revenues | | $ | 1,749 |
| | $ | 1,593 |
| | $ | 156 |
|
| | | | | | |
LNG volumes recognized as revenues (in TBtu) | | 263 |
| | 241 |
| | 22 |
|
We begin recognizing LNG revenues from the Liquefaction Project following the substantial completion and the commencement of operating activities of the respective Trains. In addition to Trains 1 through 4 of the Liquefaction Project that were operational during both the three months ended March 31, 2019 and 2018, Train 5 of the Liquefaction Project was operational for approximately a month during the three months ended March 31, 2019. The increase in revenues for the three months ended March 31, 2019 from the comparable period in 2018 was primarily attributable to the increased volumes of LNG sold following the achievement of substantial completion of Train 5 of the Liquefaction Project.
Prior to substantial completion of a Train, amounts received from the sale of commissioning cargoes from that Train are offset against LNG terminal construction-in-process, because these amounts are earned or loaded during the testing phase for the construction of that Train. During the three months ended March 31, 2019, we realized offsets to LNG terminal costs of $48
million corresponding to 10 TBtu of LNG, that related to the sale of commissioning cargoes. We did not realize any offsets to LNG terminal costs in the three months ended March 31, 2018.
Also included in LNG revenues are gains from derivative instruments, which include the realized value associated with a portion of derivative instruments that settle through physical delivery and the sale of natural gas procured for the liquefaction process. During the three months ended March 31, 2019 and 2018, we realized $45 million and $23 million, respectively, of gains from these transactions and other revenues.
Operating costs and expenses
|
| | | | | | | | | | | |
| Three Months Ended March 31, |
(in millions) | 2019 | | 2018 | | Change |
Cost of sales | $ | 879 |
| | $ | 837 |
| | $ | 42 |
|
Operating and maintenance expense | 138 |
| | 95 |
| | 43 |
|
Operating and maintenance expense—affiliate | 29 |
| | 26 |
| | 3 |
|
General and administrative expense | 3 |
| | 4 |
| | (1 | ) |
General and administrative expense—affiliate | 21 |
| | 18 |
| | 3 |
|
Depreciation and amortization expense | 114 |
| | 105 |
| | 9 |
|
Impairment expense and loss on disposal of assets | 2 |
| | — |
| | 2 |
|
Total operating costs and expenses | $ | 1,186 |
| | $ | 1,085 |
| | $ | 101 |
|
Our total operating costs and expenses increased during the three months ended March 31, 2019 from the three months ended March 31, 2018, primarily as a result of the increase in operating Trains between each of the periods and third-party service and maintenance costs from increased maintenance and related activities at the Liquefaction Project.
Cost of sales includes costs incurred directly for the production and delivery of LNG from the Liquefaction Project, to the extent those costs are not utilized for the commissioning process. Cost of sales increased during the three months ended March 31, 2019 from the three months ended March 31, 2018 due to increased volumes of natural gas feedstock related to our LNG sales as a result of substantial completion of Train 5 of the Liquefaction Project, as well as increased pricing of natural gas feedstock. Partially offsetting the increase in cost of natural gas feedstock was an increase in fair value of the derivatives associated with hedges to secure natural gas feedstock for the Liquefaction Project, due to a favorable shift in the long-term forward prices. Cost of sales also includes variable transportation and storage costs and other costs to convert natural gas into LNG.
Operating and maintenance expense primarily includes costs associated with operating and maintaining the Liquefaction Project. The increase in operating and maintenance expense (including affiliates) during the three months ended March 31, 2019 from the three months ended March 31, 2018 was primarily related to: (1) increased maintenance and related activities at the Liquefaction Project and (2) increased natural gas transportation and storage capacity demand charges from operating Train 5 of the Liquefaction Project following its substantial completion. Operating and maintenance expense (including affiliates) also includes payroll and benefit costs of operations personnel, TUA reservation charges from payments made under the partial TUA assignment agreement with Total, insurance and regulatory costs and other operating costs.
Depreciation and amortization expense increased during the three months ended March 31, 2019 from the three months ended March 31, 2018 as a result of Train 5 of the Liquefaction Project becoming operational and as the related assets began depreciating upon reaching substantial completion.
Other expense (income)
|
| | | | | | | | | | | |
| Three Months Ended March 31, |
(in millions) | 2019 | | 2018 | | Change |
Interest expense, net of capitalized interest | $ | 187 |
| | $ | 185 |
| | $ | 2 |
|
Derivative gain, net | — |
| | (8 | ) | | 8 |
|
Other income | (9 | ) | | (4 | ) | | (5 | ) |
Total other expense | $ | 178 |
| | $ | 173 |
| | $ | 5 |
|
Interest expense, net of capitalized interest during the three months ended March 31, 2019 was comparable to interest expense, net of capitalized interest during the three months ended March 31, 2018. For the three months ended March 31, 2019
and 2018, we incurred $235 million and $232 million of total interest cost, respectively, of which we capitalized $48 million and $47 million, respectively, primarily for the construction of the Liquefaction Project.
Off-Balance Sheet Arrangements
As of March 31, 2019, we had no transactions that met the definition of off-balance sheet arrangements that may have a current or future material effect on our consolidated financial position or operating results.
Summary of Critical Accounting Estimates
The preparation of our Consolidated Financial Statements in conformity with GAAP requires management to make certain estimates and assumptions that affect the amounts reported in the Consolidated Financial Statements and the accompanying notes. There have been no significant changes to our critical accounting estimates from those disclosed in our annual report on Form 10-K for the year ended December 31, 2018.
Recent Accounting Standards
| |
ITEM 3. | QUANTITATIVE AND QUALITATIVE DISCLOSURES ABOUT MARKET RISK |
Marketing and Trading Commodity Price Risk
We have entered into commodity derivatives consisting of natural gas supply contracts for the commissioning and operation of the Liquefaction Project (“Liquefaction Supply Derivatives”). In order to test the sensitivity of the fair value of the Liquefaction Supply Derivatives to changes in underlying commodity prices, management modeled a 10% change in the commodity price for natural gas for each delivery location as follows (in millions):
|
| | | | | | | | | | | | | | | |
| March 31, 2019 | | December 31, 2018 |
| Fair Value | | Change in Fair Value | | Fair Value | | Change in Fair Value |
Liquefaction Supply Derivatives | $ | 29 |
| | $ | 1 |
| | $ | (43 | ) | | $ | 7 |
|
ITEM 4. CONTROLS AND PROCEDURES
We maintain a set of disclosure controls and procedures that are designed to ensure that information required to be disclosed by us in the reports filed by us under the Exchange Act is recorded, processed, summarized and reported within the time periods specified in the SEC’s rules and forms. As of the end of the period covered by this report, we evaluated, under the supervision and with the participation of our general partner’s management, including our general partner’s Chief Executive Officer and Chief Financial Officer, the effectiveness of our disclosure controls and procedures pursuant to Rule 13a-15 of the Exchange Act. Based on that evaluation, our general partner’s Chief Executive Officer and Chief Financial Officer concluded that our disclosure controls and procedures are effective.
During the most recent fiscal quarter, there have been no changes in our internal control over financial reporting that have materially affected, or are reasonably likely to materially affect, our internal control over financial reporting.
PART II. OTHER INFORMATION
ITEM 1. LEGAL PROCEEDINGS
We may in the future be involved as a party to various legal proceedings, which are incidental to the ordinary course of business. We regularly analyze current information and, as necessary, provide accruals for probable liabilities on the eventual disposition of these matters. There have been no material changes to the legal proceedings disclosed in our annual report on Form 10-K for the year ended December 31, 2018.
On May 3, 2019, SPL and Cheniere Marketing entered into an amendment to the base SPA to remove certain conditions related to the sale of LNG from Trains 5 and 6 of the Liquefaction Project and provide that cargoes rejected by Cheniere Marketing under the base SPA can be sold by SPL to Cheniere Marketing at a contract price equal to a portion of the estimated net profits from the sale of such cargo.
On May 3, 2019, SPL and Cheniere Marketing entered into a letter agreement for the sale of up to 20 cargoes totaling approximately 70 million MMBtu scheduled for delivery between May 3 and December 31, 2019 at a price of 115% of Henry Hub plus $2.00 per MMBtu.
|
| | |
Exhibit No. | | Description |
10.1* | | |
10.2* | | |
31.1* | | |
31.2* | | |
32.1** | | |
32.2** | | |
101.INS* | | XBRL Instance Document - the instance document does not appear in the Interactive Data File because its XBRL tags are embedded within the Inline XBRL document. |
101.SCH* | | XBRL Taxonomy Extension Schema Document |
101.CAL* | | XBRL Taxonomy Extension Calculation Linkbase Document |
101.DEF* | | XBRL Taxonomy Extension Definition Linkbase Document |
101.LAB* | | XBRL Taxonomy Extension Labels Linkbase Document |
101.PRE* | | XBRL Taxonomy Extension Presentation Linkbase Document |
|
| |
* | Filed herewith. |
** | Furnished herewith. |
Pursuant to the requirements of the Securities Exchange Act of 1934, the registrant has duly caused this report to be signed on its behalf by the undersigned, thereunto duly authorized.
|
| | | |
| | CHENIERE ENERGY PARTNERS, L.P. |
| | By: | Cheniere Energy Partners GP, LLC, |
| | | its general partner |
| | | |
Date: | May 8, 2019 | By: | /s/ Michael J. Wortley |
| | | Michael J. Wortley |
| | | Executive Vice President and Chief Financial Officer |
| | | (on behalf of the registrant and as principal financial officer) |
| | | |
Date: | May 8, 2019 | By: | /s/ Leonard E. Travis |
| | |